

How to Increase Repeat Purchases for Non-Consumable Products
7 min read
Last updated
Share
In this article
Direct answer: To increase repeat purchases for non-consumable products, stop timing messages to when the product runs out and start timing them to what the customer is likely to need next. Sticky Digital recommends three flows built on the first-to-second order curve: a completion flow that starts about two weeks after delivery and recommends a different product than the one bought, an occasion flow that returns at the annual gift or season window, and a life stage flow where the product has one, such as kids’ sizing or a room refresh. Measure the work by 90-day repeat rate and time to second order, not by replenishment revenue.
Sticky Digital’s perspective: repeat buying is a different curve, not a smaller one
Search for how to increase repeat purchases and most of what comes back was written for things that run out. Replenishment reminders. Subscriptions. Points programs. That advice works on a bottle of serum. It does very little for a sofa.
We work inside Klaviyo accounts for DTC brands every day, and the first-to-second order curve is the number we check first. For non-consumable brands it doesn’t disappear. It moves. In an apparel client’s account with 99,207 first-time buyers, 23.5 percent bought again within 12 months. Klaviyo’s own glossary puts a good repeat purchase rate at roughly 20 to 30 percent and says it runs lower for high-value goods. That brand sits inside the range, and nothing it sells gets used up.
So the question changes. Not when will the customer run out, but what are they most likely to need next, and when. Everything below comes from that question.
What drives repeat purchases for non-consumable products?
We plan around three triggers. They’re our framework, not an industry standard, so check them against your own order data before you build.
Completion
The first product creates a gap. A dress needs shoes. A serving bowl needs the set. A sofa needs the side table. Completion is the fastest trigger because the customer already decided they like you, and the second order often lands within weeks.
Occasion
Gifts, holidays, weddings, a change of season. In the tabletop and home account we studied, 22 percent of repeat orders arrived more than 360 days after the customer’s previous order. That looks like an annual rhythm, though the data doesn’t say why, so treat it as a pattern to test rather than a fact about your customers.
Life stage
Kids outgrow sizes. People move. Registries close. This trigger only works if you collect the signal: a birth date, a size, a move date. If you don’t, it’s closed to you, and one preference question in the post-purchase flow is the cheapest way to open it.
Want this checked in your own account?
We review your flows, segments, campaigns and deliverability in a 35 to 40 page audit, delivered in 3 to 5 days.
When do repeat purchases for non-consumable products happen?
Earlier than most brands plan for. Here is the first-to-second order curve for that apparel account, built from first-time buyers acquired between January 2024 and September 2025.
| Window after first order | First-time buyers who had ordered again |
|---|---|
| 30 days | 8.2% |
| 90 days | 12.5% |
| 180 days | 17.0% |
| 365 days | 23.5% |
Source: Hiro analytics, anonymized apparel client, 99,207 first-time buyers.
Do the division. Of the 23.5 percent who came back within a year, 12.5 points came back inside 90 days. That’s 53 percent of all 12-month repeat buyers, in the first quarter. The curve keeps climbing after that, but slowly.
A second account tells a different story. Over the last 12 months, a tabletop and home client logged 19,007 repeat orders. The median gap between orders was 63 days. Thirty-nine percent of repeat orders arrived within 30 days of the previous one, 49 percent within 60 days, and 22 percent after more than a year. That’s two clusters, not one curve: fast completion orders and slow annual returns.
One limit. We don’t have a furniture-only cohort we can publish. Treat this timing as apparel and tabletop evidence, and expect big-ticket categories to run slower.
Do email and SMS drive repeat orders when nothing runs out?
They do, with a caveat about what the numbers can prove. In Hiro, email and SMS attribution covers 11.4 of the apparel account’s 23.5 points of 12-month repeat rate. About half. In the tabletop account, 12,480 of the 19,007 repeat orders, roughly two-thirds, were credited to a message.
Attributed orders also came sooner. The median was 49 days after the prior order, against 124 days for orders no message claimed.
That’s attribution, not proof of cause. A customer who was already coming back may click an email on the way in. The cleaner test is a holdout on the completion flow, and it’s the first experiment we’d run. Other guides are on the Sticky Digital retention blog.
Why replenishment logic fails for non-consumable products
The most common failure is a consumable flow with the labels changed. A timer fires on day 30 or day 45. The subject line says it’s time to reorder. The product block pulls the item the customer just bought back into the email.
The data says that aims at the wrong target. In the apparel account, between one in seven and one in three repeat buyers purchased the same product again, depending on the first-purchase month. Across monthly cohorts, same-product repeat ran from 2.8 to 8.0 percent of first-time buyers, against overall 12-month repeat rates of 19 to 27 percent. Most repeat buyers came back for something else.
The second failure is the lapsed-customer timer. A standard winback flow starts at 90 days. In this account, more than half of the customers who bought again within the year had already done it by then. A 90-day winback isn’t wrong. It’s a late plan to be the only plan.
How to increase repeat purchases for non-consumable products with Klaviyo flows
Four mechanics, in the order we’d build them. The timing is design guidance drawn from the curves above, not a measured result, so test it against your own data.
1. A completion flow triggered by what they bought
Trigger on product type or collection, not on a timer alone. Start about two weeks after delivery and run through day 60, so the flow finishes inside the window where most repeat buying happens. Recommend a different category than the one purchased.
2. Exclusion logic in every product block
Suppress the item they bought, anything they returned, and anything already in their order history. It sounds small. In a flow built to cross-sell, a repeated product is the fastest way to look like you weren’t paying attention.
3. An occasion flow set at about month 11
If your data shows an annual return, as the tabletop account does, send ahead of it. A trigger around month 11 lands before the gift or season window opens instead of after the customer has already shopped elsewhere.
4. A separate track for holiday first-time buyers
In the apparel account, December first-time buyers repeated at 19.3 percent over 12 months, against 22 to 27 percent for every other month. December 2025 shows the same shape at six months: 11.4 percent, against 14 to 21 percent for other cohorts. We read that as gift buying, but Hiro doesn’t tag gift orders, so it’s a hypothesis. Either way, these buyers need a different second-order message than a customer who chose the product for themselves.
Brands building this inside Klaviyo can see how we scope email and SMS flow builds for retention programs.
FAQ
What is a good repeat purchase rate for non-consumable products?
Klaviyo’s glossary puts a good repeat purchase rate at roughly 20 to 30 percent and says it runs lower for high-value goods. In an apparel account Sticky Digital analyzed, 23.5 percent of 99,207 first-time buyers ordered again within 12 months, and monthly cohorts ranged from 19 to 27 percent.
How soon after the first order should a brand send a second-purchase message?
About two weeks after delivery, with the flow running through day 60. In the apparel data Sticky Digital reviewed, 53 percent of the customers who bought again within a year did so inside the first 90 days.
Do subscriptions work for products that don’t run out?
Rarely. A subscription fits something the customer uses up. For apparel, furniture, and decor, the closer equivalent is an early-access or membership tier that rewards the second order, not a scheduled shipment.
Does this approach work for furniture and other big-ticket items?
The logic holds, with a longer horizon. Sticky Digital doesn’t have a furniture-only cohort to publish. For sofas, beds, and tables, the completion cycle runs room by room over months or years, so a 30-to-90-day accessory flow paired with an annual check-in is a reasonable starting design.
Brands that want a read on their own first-to-second order curve can ask for a free Klaviyo audit.
Article By: Mariel Kilroy, Co-Founder, Sticky Digital
Mariel Kilroy is the Co-Founder of Sticky Digital, a retention marketing agency specializing in email, SMS, loyalty, and subscription growth for DTC brands.
Last updated October 30, 2026
Retention only, since 2019.








Emails we have designed and shipped.
 American Optical
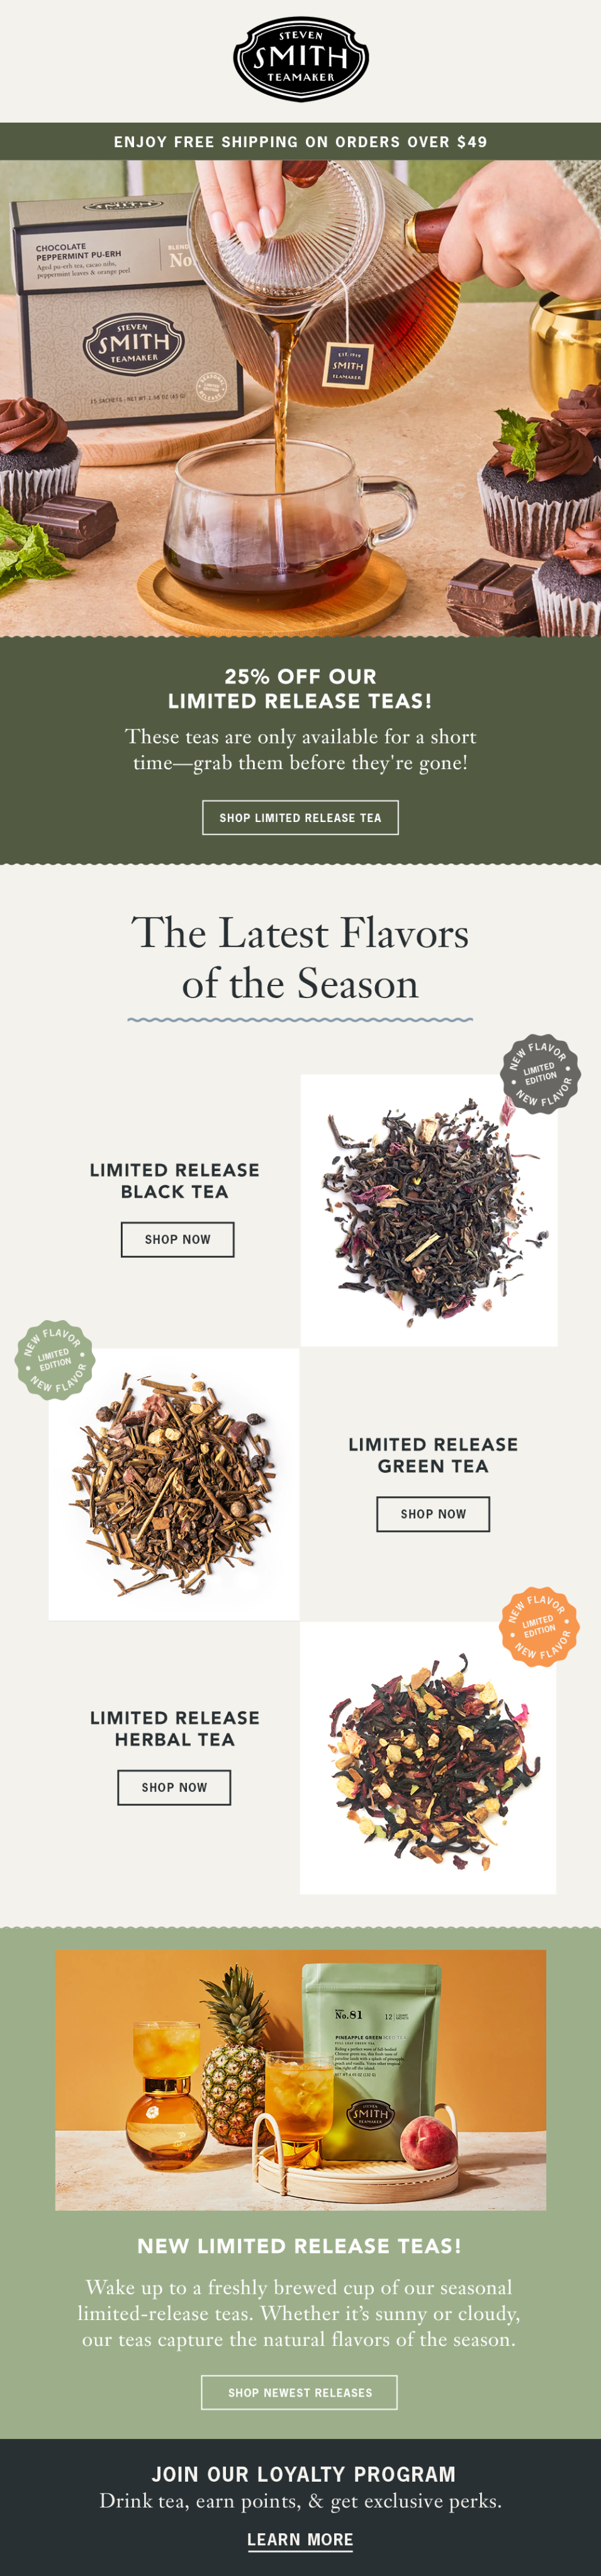 Smith Teamaker
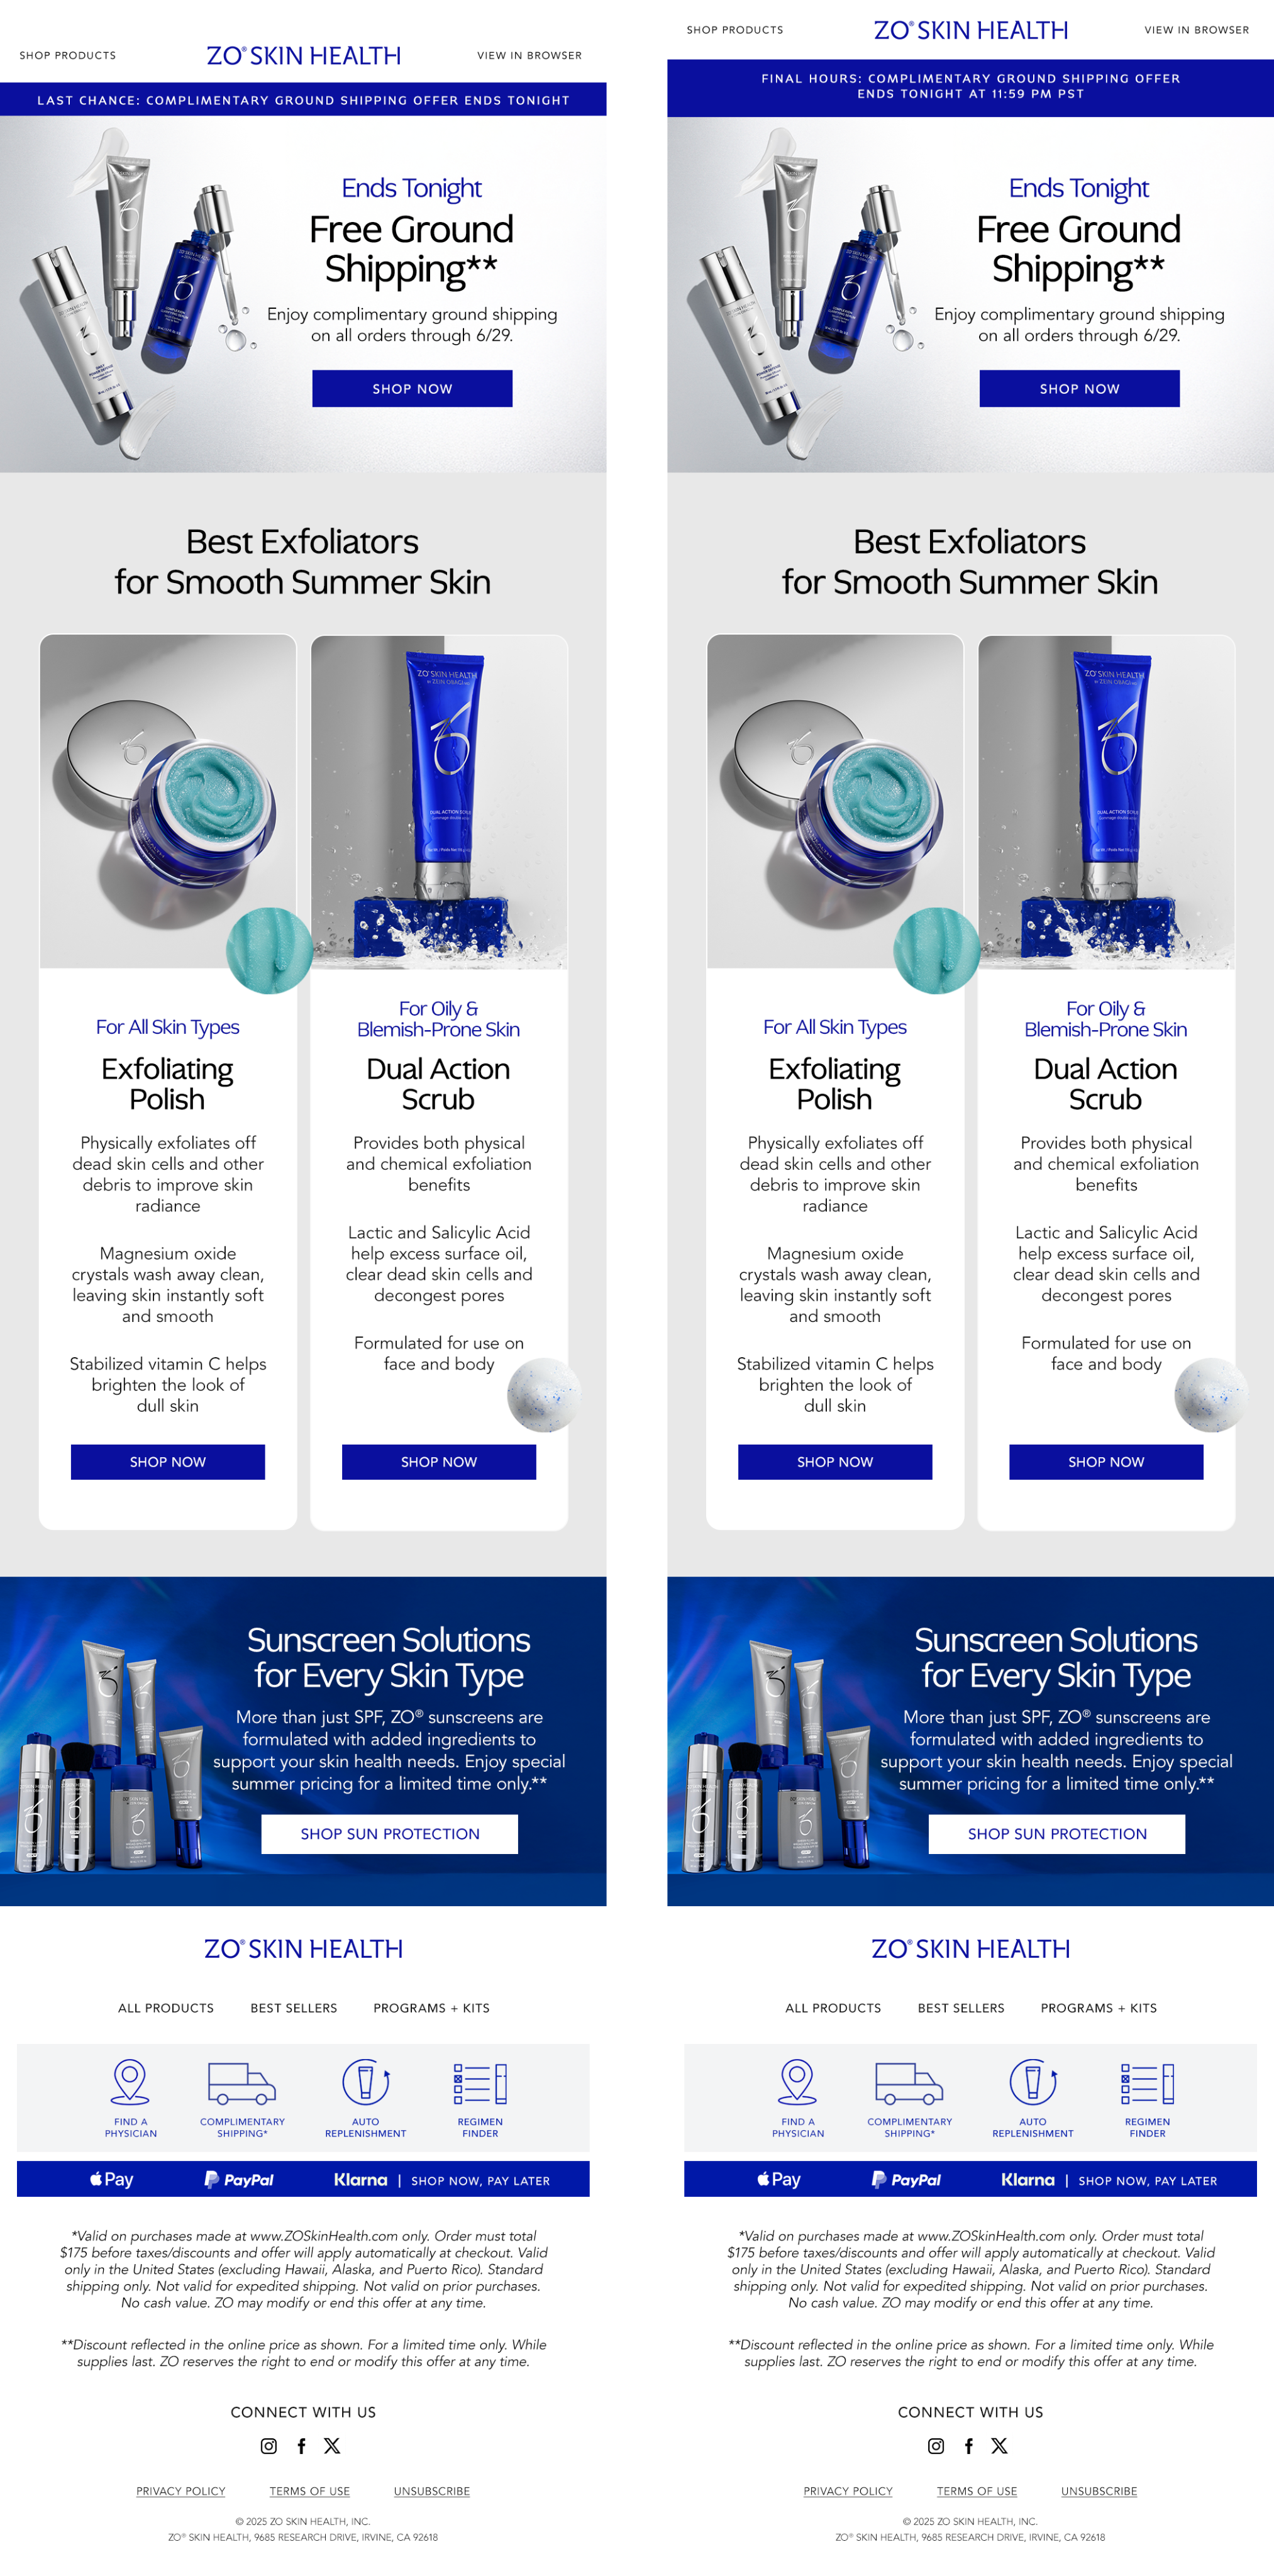 ZO Skin
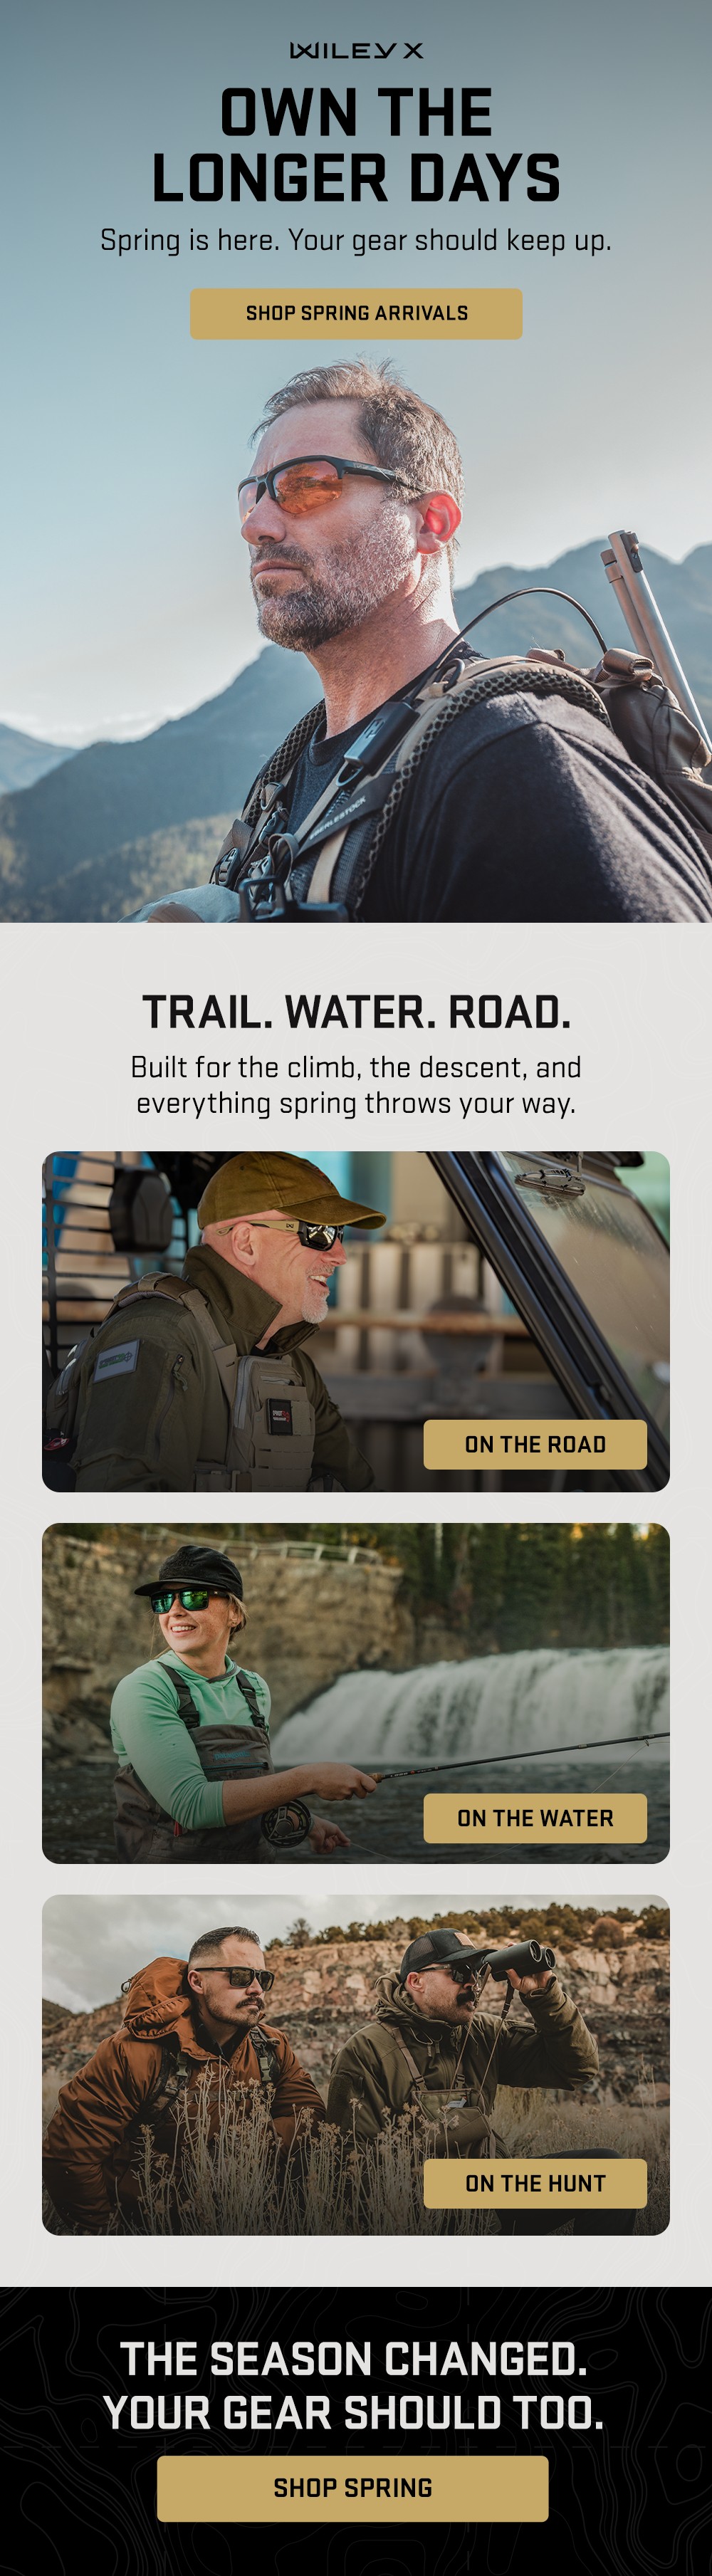 Wiley X
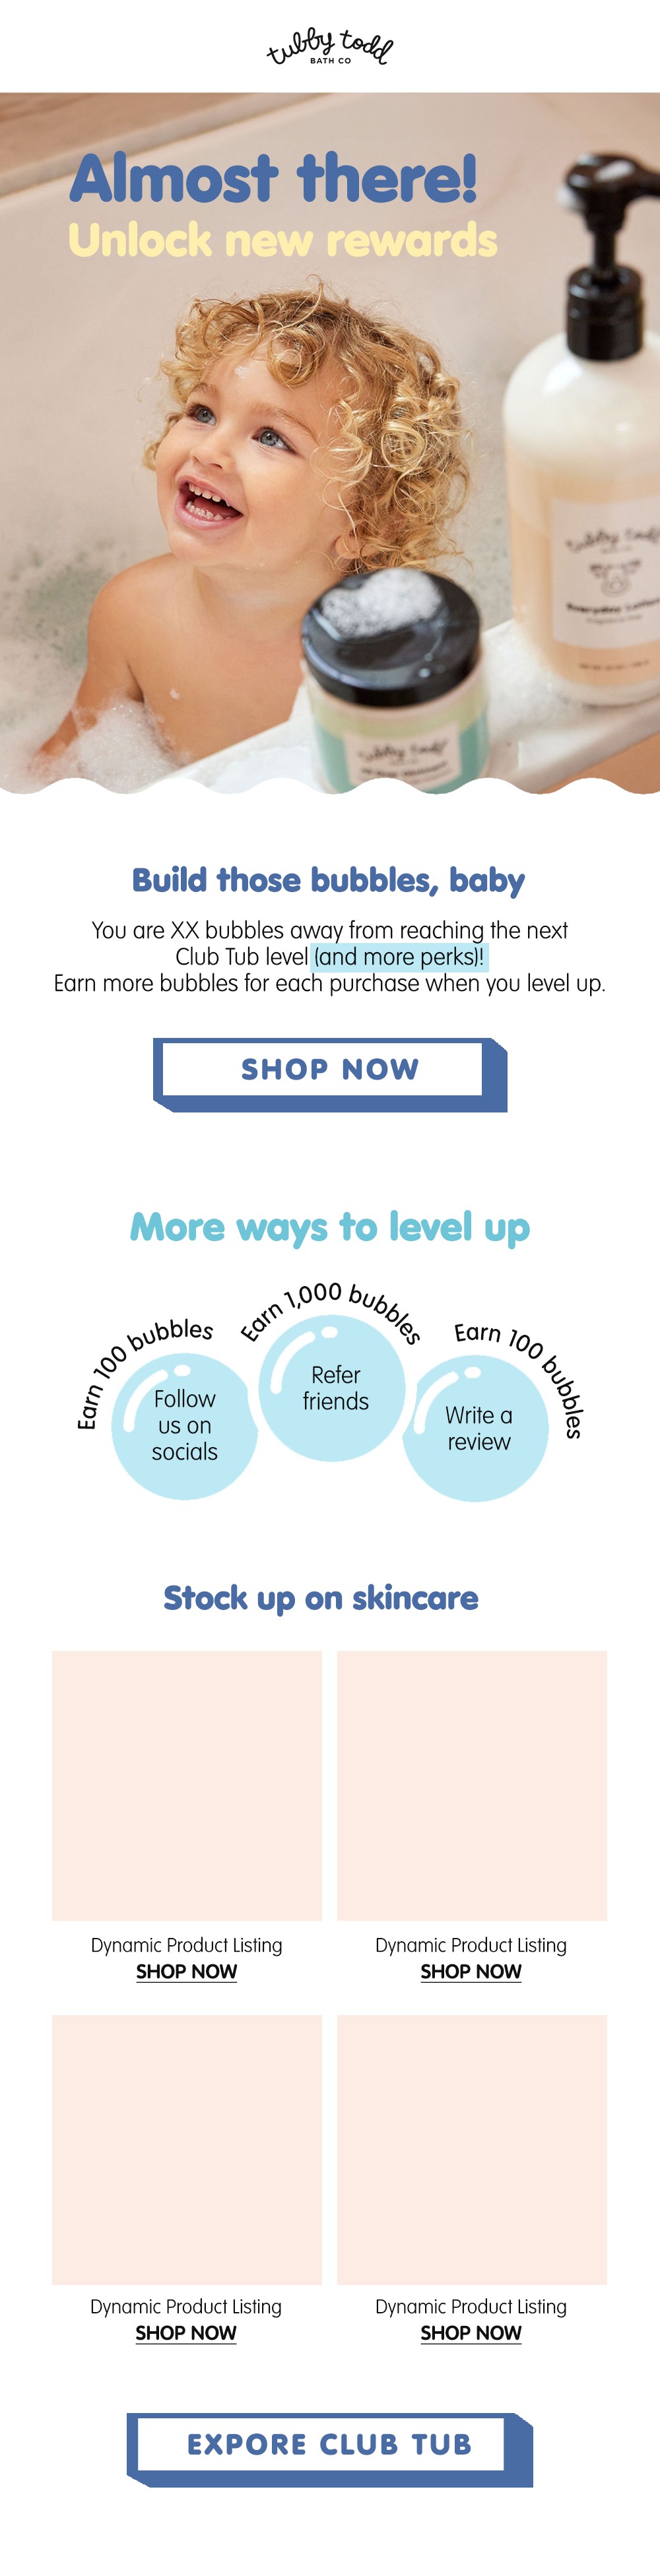 Tubby Todd
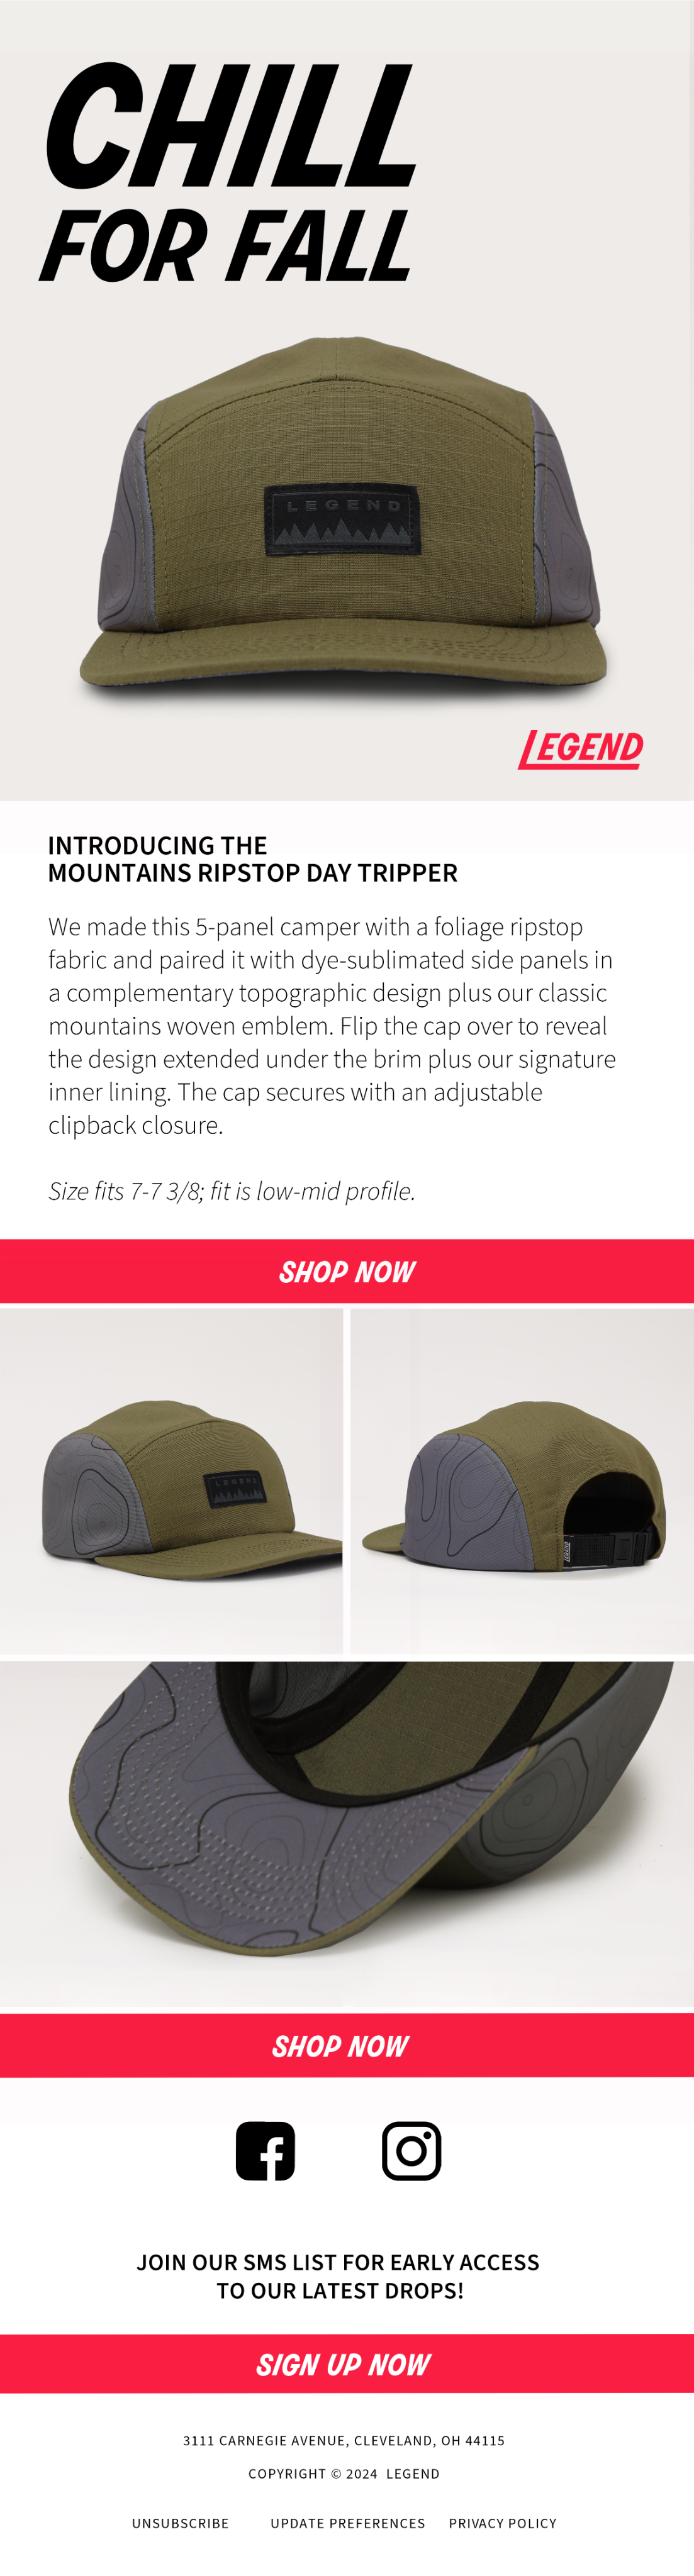 Legend Headwear
 Calaswim
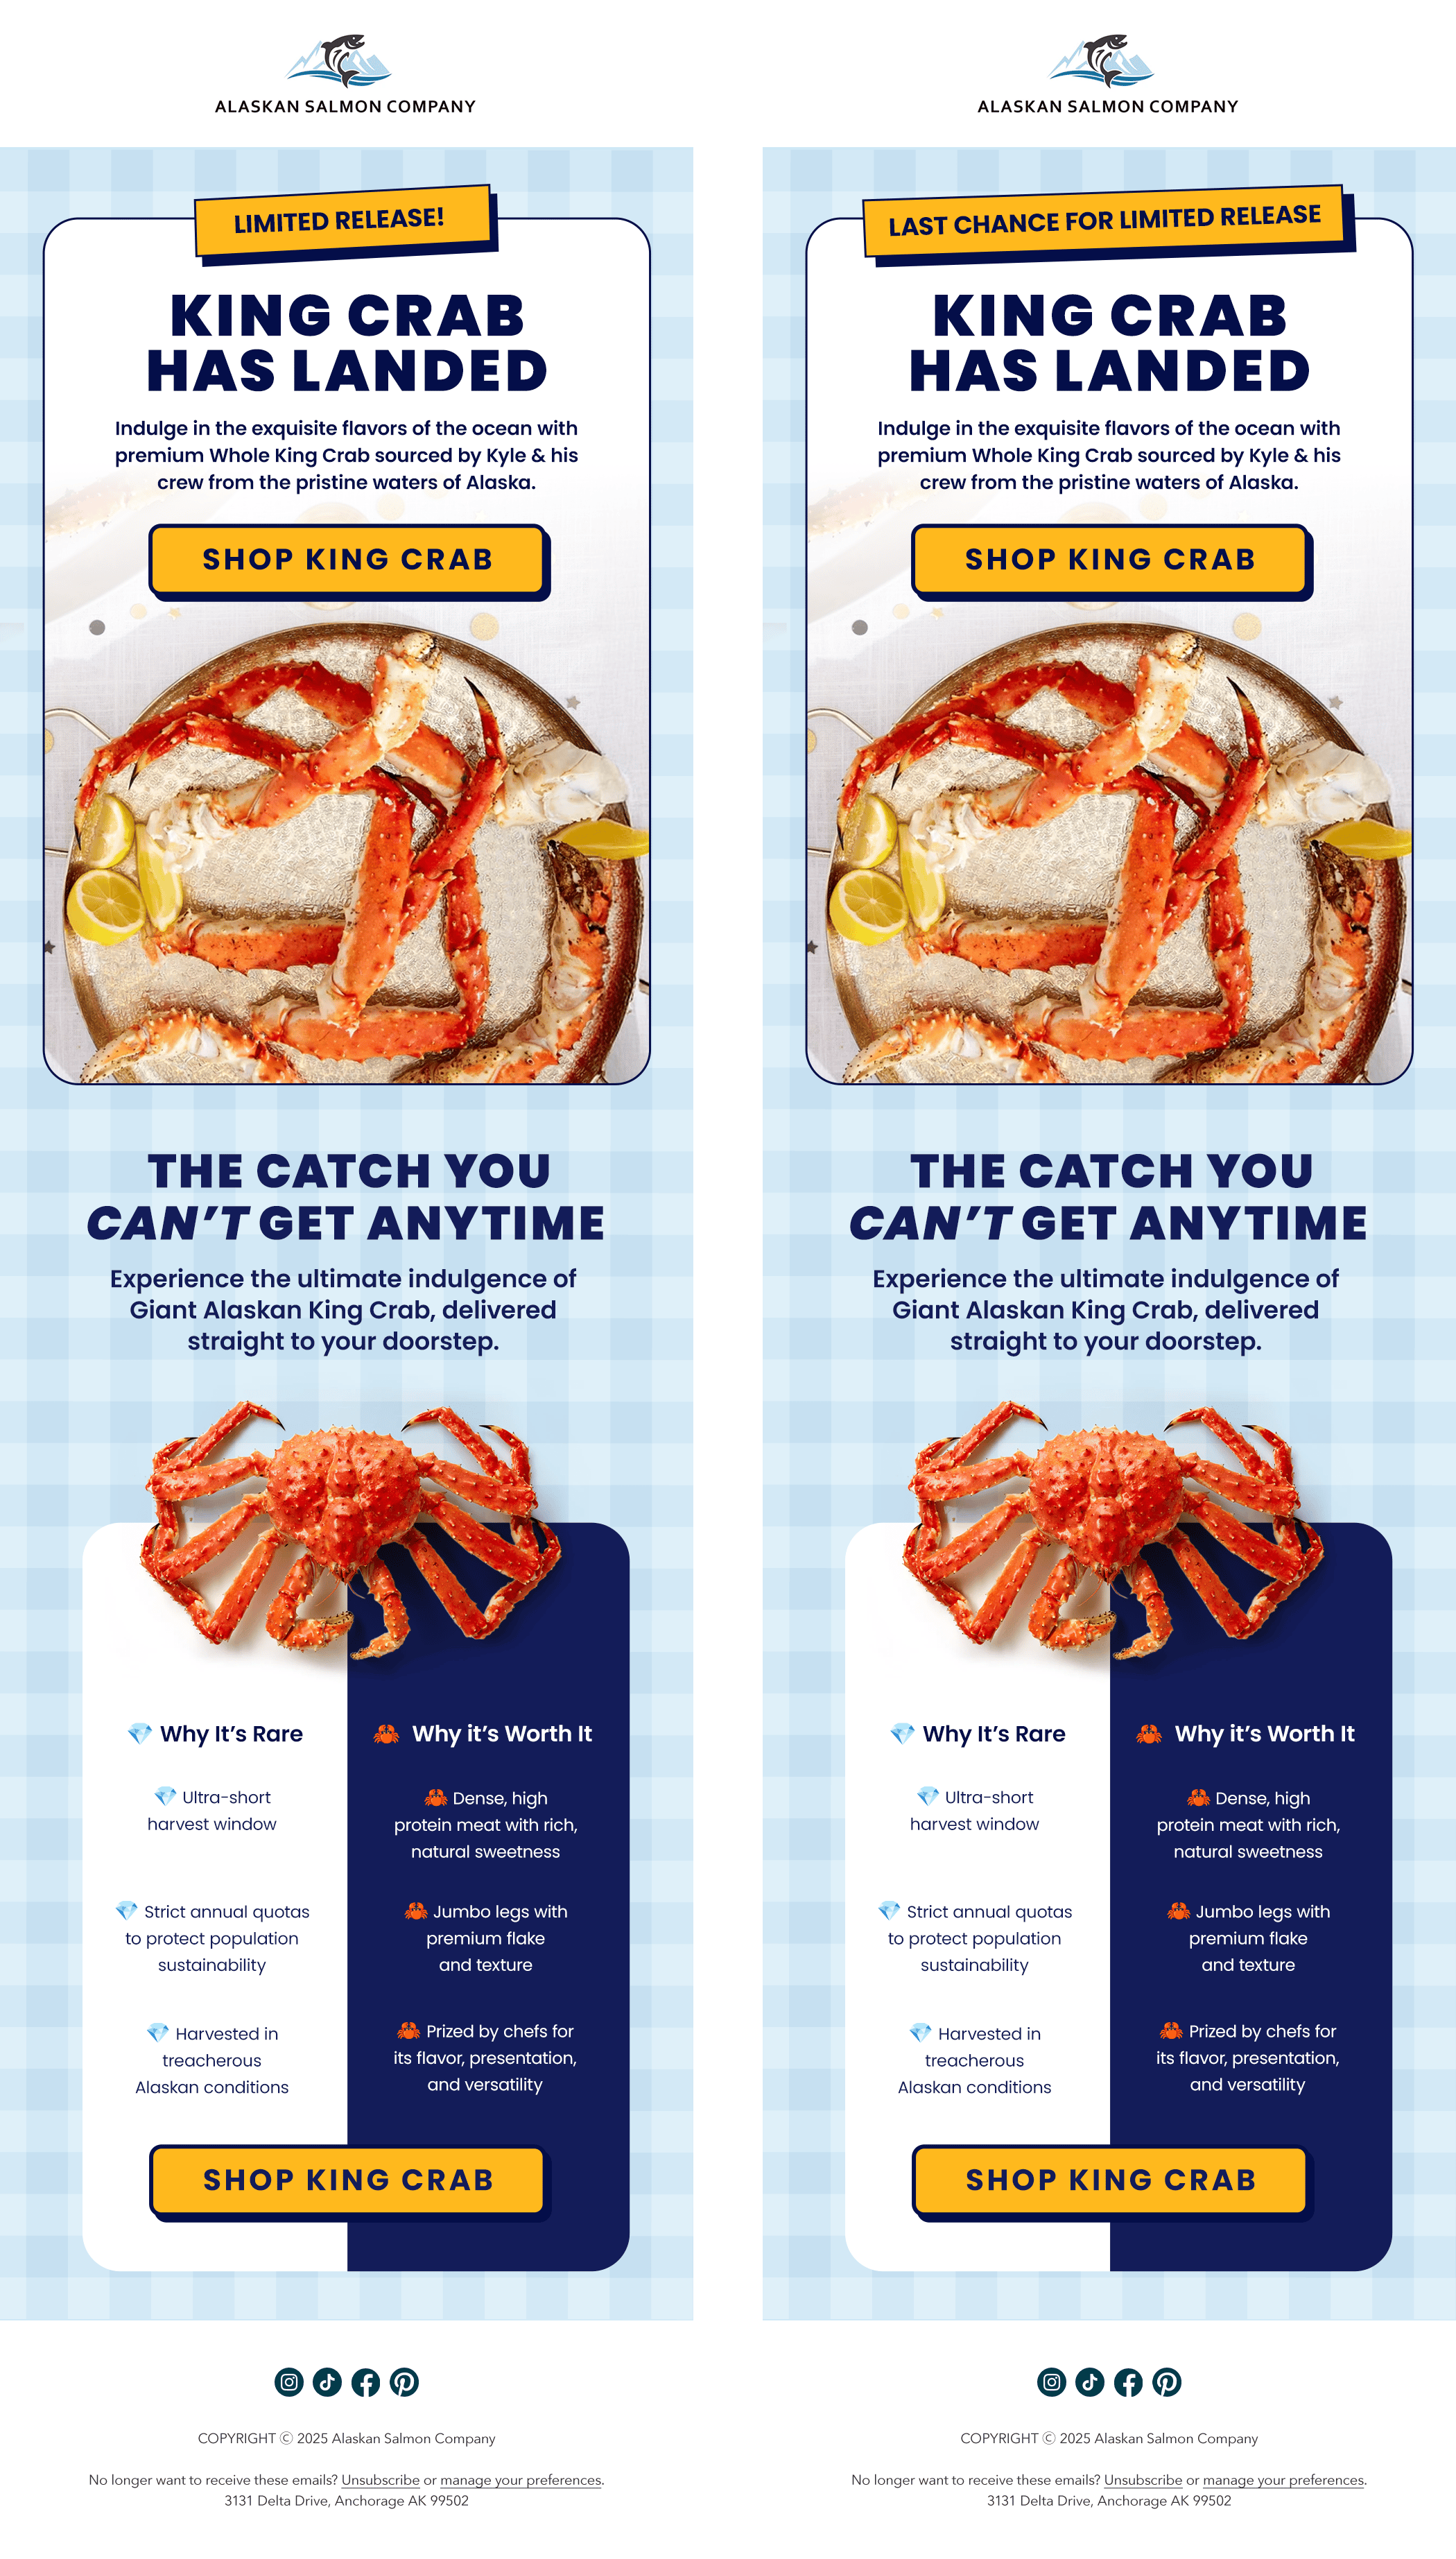 Alaskan Salmon Co.
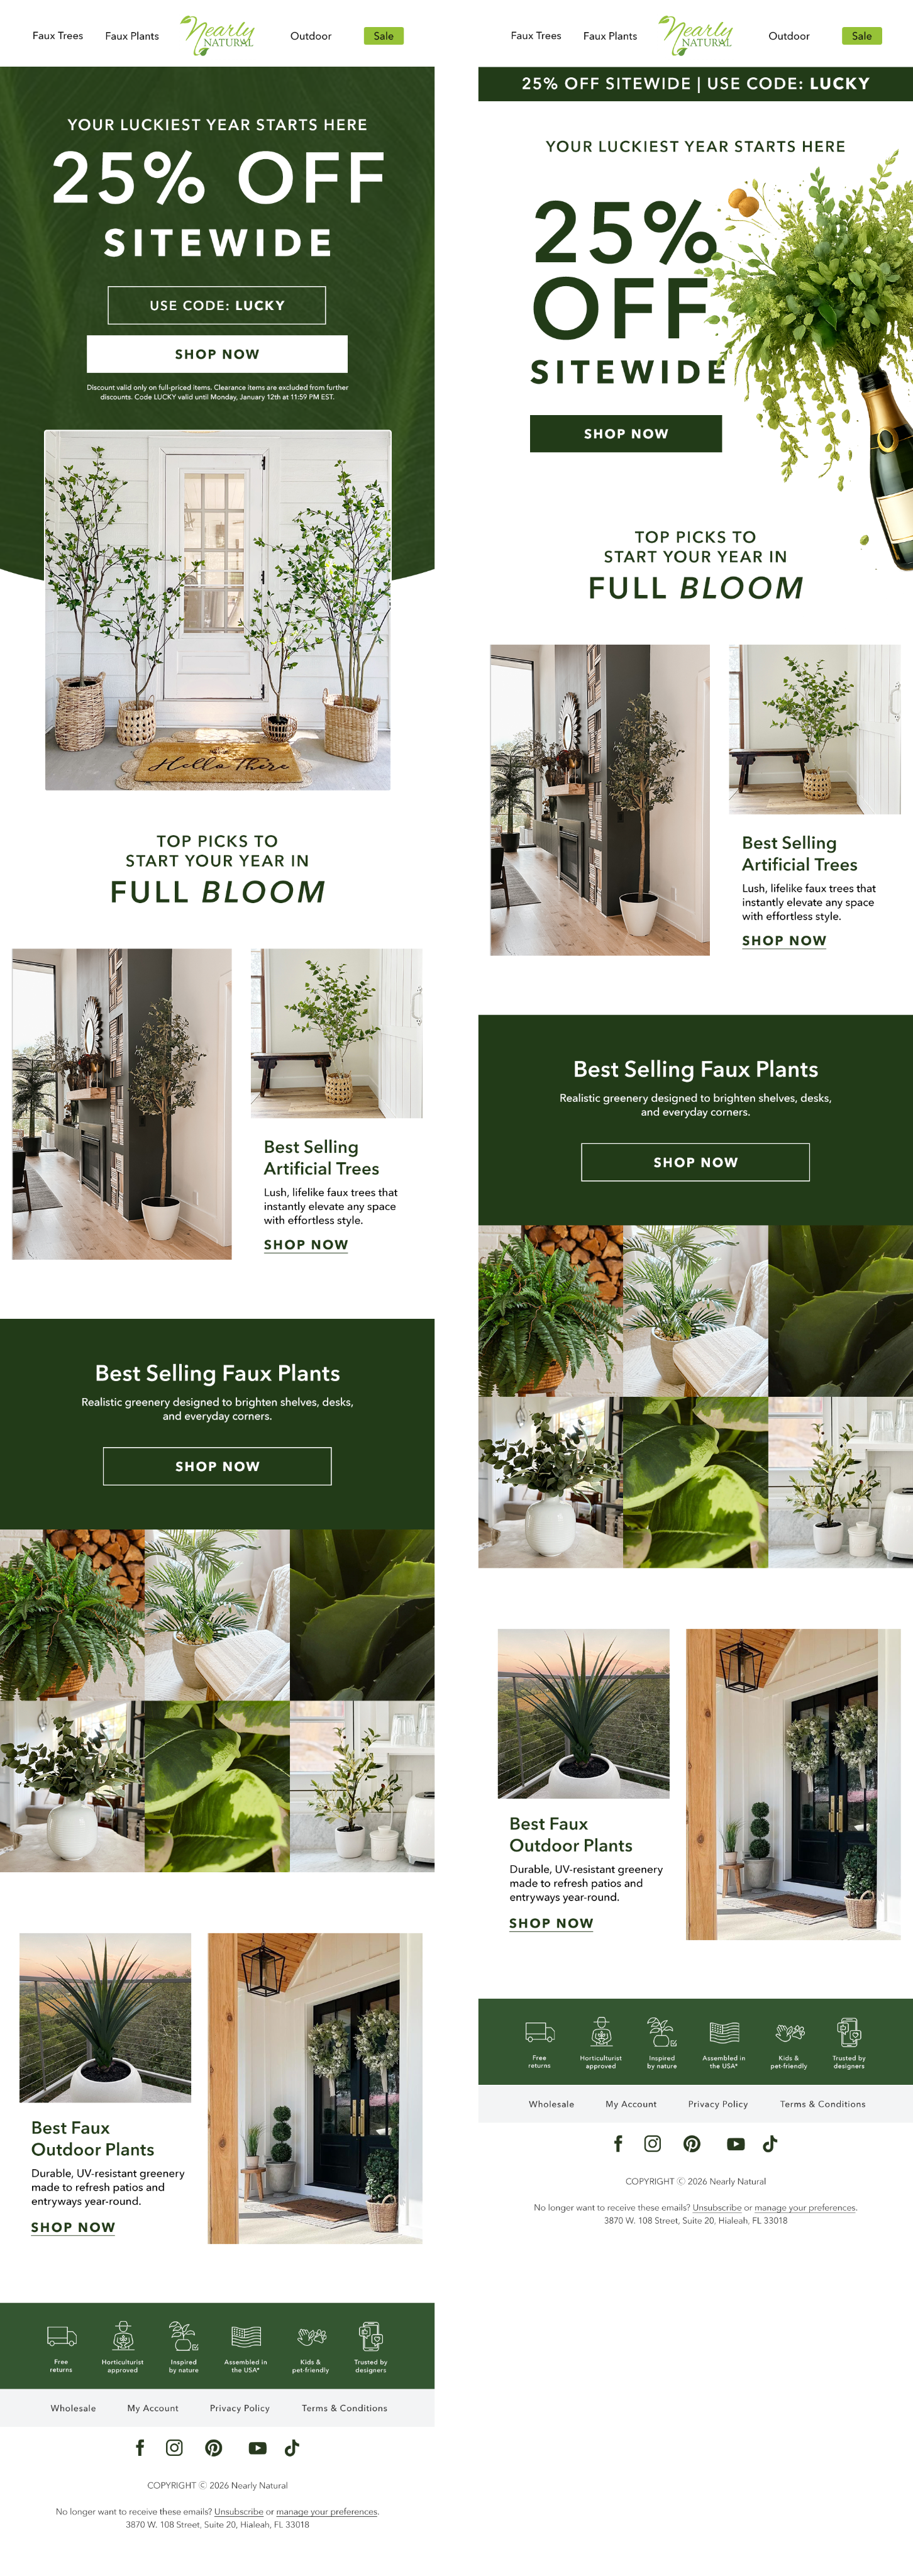 Nearly Natural
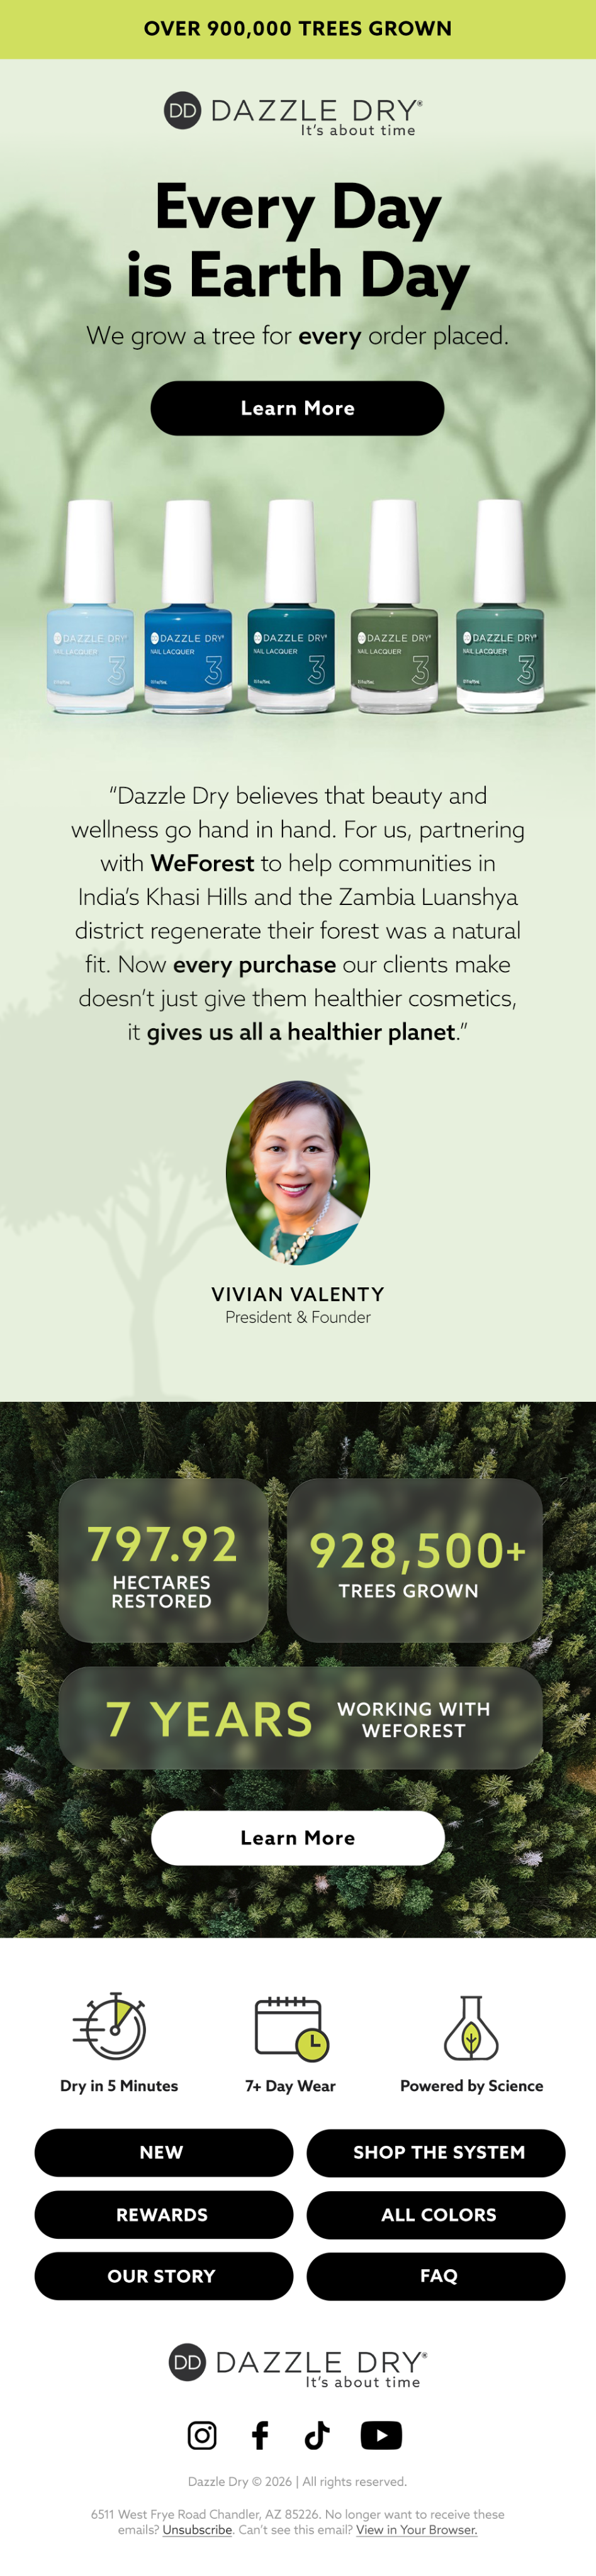 Dazzle Dry
More from Direct to Consumer Retention Topics



Find out what your program is leaving on the table.
A 35 to 40 page audit of your email and SMS program, delivered in 3 to 5 days. It is yours to keep whether or not we work together.
Get my free audit See pricing