

How to Improve Pop-Up Opt-In Rate: Benchmarks and Risks
9 min read
Last updated
Share
In this article
Last updated October 28, 2026
Direct answer: To raise pop-up opt-in rate, Sticky Digital recommends working in this order. Confirm the pop-up shows on the right pages to the right visitors. Stop displaying the discount code on screen and send it by email or SMS instead. Test one variable at a time, starting with step order and offer framing. Consider a different tool or trigger only after that. Judge every change by the open rate and unsubscribe rate of the people it adds over the following 30 days, because a pop-up that lifts submits while dragging engagement down has not improved the list.
What we see when we review pop-up reports
When a pop-up underperforms, the first question we ask is not about the headline. It is who is seeing the pop-up. In one kids’ products account, list growth fell 74% year over year, to 22,000 new subscribers from 83,000, while site traffic rose 37%. Paid social sessions had climbed from roughly 19,000 to 875,000. Copy tests on the main pop-up and the exit-intent pop-up barely moved the result.
The tests were not the constraint. The traffic was. A pop-up can only convert the visitors it is shown, and a surge of cold social sessions pulls the rate down whatever the pop-up says.
The second pattern is quieter. Sign-up rate and list quality move independently of each other, and most pop-up dashboards only report the first one. We will get to the account where that mattered.
What is a good pop-up opt-in rate in 2026?
It depends on whose data you read, and the studies measure different things. Here are the four we use most.
| Source | What it measured | Result |
|---|---|---|
| Omnisend, 2025 data | Email pop-up conversion across 1.24 billion displays | 2.1% average, down from 2.3% |
| Wisepops, 2026 report, as summarized by BDOW | Pop-up conversion across 1 billion displays | 4.82% average, up from 4.65% |
| Popupsmart, 2026 benchmark | Pop-ups collecting an email or phone number, per display | 0.83% median, 3.87% for the top 10% |
| Omnisend rating scale, as cited by Crazy Egg | Email sign-up rate per display | Under 1.5% weak, 1.5% to 3% average, 3% to 5% good, over 5% excellent |
The spread comes from method. Omnisend counts email-only sign-ups per display. Popupsmart counts email or phone. Wisepops draws from a different mix of sites. None of them is wrong, and none is your number.
So where does 8% to 10% come from? Mostly from vendors and from one mechanic. One pop-up vendor reported that gamified pop-ups averaged 8.08% against a 3.67% baseline in its own data. AI-driven pop-up platforms report averages of 10% or more among their own customers. A popular tiering from another vendor labels 8% and up as top performer. Treat those as ceilings that specific formats can reach, not as the industry average.
Our read: under 1.5% means something is broken. Between 2% and 4% is normal for a standard discount pop-up. Past 8% usually means a particular mechanic is carrying the number, which makes list quality the thing to check next.
Want this checked in your own account?
We review your flows, segments, campaigns and deliverability in a 35 to 40 page audit, delivered in 3 to 5 days.
Is traffic the problem before the pop-up is?
Often, yes. A beauty client reported a sharp revenue drop. Attributed email and SMS revenue was actually up year over year. What had changed was where visitors came from: about 8,000 more monthly sessions from TikTok, about 8,000 fewer from Instagram, and a 40% drop in add-to-cart conversion site-wide. The pop-up’s lower conversion was a symptom of that shift.
That account also had a real pop-up bug, and it is worth checking in yours. A display rule used the operator “contains any of” where it needed “does not contain any of.” That limited the pop-up to a handful of pages, such as cart and login, from April until the fix in mid-June. Performance did not recover after the fix, which told us the bug was a contributor and the traffic was the driver.
Check your display rules and your top traffic sources before you write a single new headline.
Which pop-up changes lift opt-in rate?
Stop showing the code on screen
On two client accounts this quarter, the welcome pop-up displayed the discount code on screen. That let visitors take the discount without needing the email, which weakened the welcome flow’s reason to exist. We are moving both to sending the code by email or SMS. The sign-up still happens, and the welcome flow regains its job as the first message a subscriber opens.
Test step order, and do not copy the winner from another account
For a wellness client, moving the interest question from the first step to the last step produced about 18% more sign-ups, even though that version had fewer unique impressions. The same test on a different account was won by the first-step version. Both results are real. Audiences differ, which is the whole argument for testing on your own traffic.
Try a mystery or game mechanic where the audience fits
A wellness client whose core customers are 55 and older tested a “mystery discount” against a standard offer. It reached statistical significance and lifted email opt-in by 19% and SMS opt-in by 25%. The brand made it permanent. We would not assume the same mechanic suits a younger, discount-hunting audience, which leads to the next section.
Get the offer right, but do not overrate it
Omnisend’s data shows pop-ups with a discount converting at 2.2% against 1.7% without one. That is a lift, and a modest one. A discount helps less than correct targeting and a clean reveal.
Small rate changes still add up
One client’s SMS-first pop-up moved its submit rate from 0.58% to 0.68%. That is one-tenth of a point, and it added about 150 subscribers a week.
Can a higher opt-in rate hurt deliverability?
It can, when the extra sign-ups come from people who wanted something other than your email. A wellness client added an AI-triggered second pop-up. It fires only when a visitor has closed the first pop-up and still looks like a high-intent shopper. Sessions rose, and conversion rate dipped.
The subscribers it added entered a win-back welcome flow whose two emails opened at 19% and 20%, which Klaviyo flagged as needing attention. Over 30 days the account’s overall open rate fell by almost 10%, though a couple of sends to a wider active segment contributed. Unsubscribe rate moved back above the recommended benchmark for the first time in a while.
Our working read, and it is a read, not a proven cause: those visitors looked high-intent for buying but not for email. They wanted the discount. The pop-up counted them as wins, and the inbox providers counted them as people who did not open.
The stakes are concrete. Google’s sender guidance asks bulk senders to keep spam rates in Postmaster Tools below 0.10% and never reach 0.30%. And Klaviyo’s help center calls double opt-in a best practice for deliverability. It adds friction and lowers the sign-up rate, so single opt-in is a trade. If you run single opt-in, filter bots from the welcome flow and suppress profiles that never engage.
Why optimizing for sign-up rate alone fails
The failure has a specific shape. A tool gets chosen because it raises submit rate. New profiles drop into the same newsletter list as engaged subscribers. Nobody tags the source. The blended open rate slips, the weekly dashboard reports opt-in rate going up, and by the time someone asks why Gmail placement changed, the cohort is three months old and indistinguishable from everyone else.
Three checks catch it early. Tag every pop-up by source. Compare each new cohort’s 30-day open, click and unsubscribe rates against your baseline. And hold the pop-up’s “win” until that comparison is done.
How Sticky Digital runs pop-up optimization
As a Klaviyo Platinum Partner, we run pop-up work as part of the welcome program, not as a separate widget. The mechanics we use repeatedly:
- Audit display rules and traffic sources before testing copy.
- Withhold the code from the pop-up screen and deliver it by email or SMS, and launch the welcome series alongside the pop-up so the first message exists on day one.
- Test one variable per test and keep results per account, since a winner on one site lost on another.
- Segment each new cohort by source and compare its 30-day engagement against baseline.
- Keep pop-ups from colliding. On one account we limited the exit-intent pop-up to new visitors so it would not fight a cart-abandonment pop-up that earned more revenue from existing customers.
The same weekly deliverability check that watches bounces and unsubscribes also watches the welcome flow for bot patterns, which is how a high bounce rate in one welcome series got flagged before Black Friday. You can see the rest of our retention work on the services page.
FAQ
What is a good email pop-up opt-in rate?
Studies of more than a billion displays put the average between about 2% and 5%, depending on method. Omnisend’s scale rates under 1.5% as weak, 1.5% to 3% as average, 3% to 5% as good, and over 5% as excellent. Compare your rate against those ranges, then against your own 90-day baseline.
Can a brand reach an 8% to 10% opt-in rate?
Some do, usually with a specific format. Gamified pop-ups averaged 8.08% in one vendor’s data, and AI-driven platforms report 10% or more among their own customers. Those are vendor-reported figures, so test on your own traffic and check the 30-day engagement of the new subscribers before counting it as a win.
Does a higher opt-in rate hurt deliverability?
It can if the added sign-ups are low intent. In one client account, sign-ups from a second-chance pop-up opened a win-back flow at 19% to 20% and overall open rate fell nearly 10% over 30 days. Track each new cohort’s open and unsubscribe rates separately.
Should I use double opt-in on my pop-up?
Klaviyo describes double opt-in as a best practice for protecting deliverability, and it also costs some sign-ups. Brands that choose single opt-in for volume should filter bots from the welcome flow and suppress never-engaged profiles.
How long should a pop-up A/B test run?
Run it until it reaches statistical significance, and look at downstream engagement, not only submits. One client test reached significance on a 19% email and 25% SMS lift before being made permanent.
Brands that want a pop-up and welcome flow review can start with a conversation with our team.
Article By: Mariel Kilroy, Co-Founder, Sticky Digital
Mariel Kilroy is the Co-Founder of Sticky Digital, a retention marketing agency specializing in email, SMS, loyalty, and subscription growth for DTC brands.
Retention only, since 2019.








Emails we have designed and shipped.
 American Optical
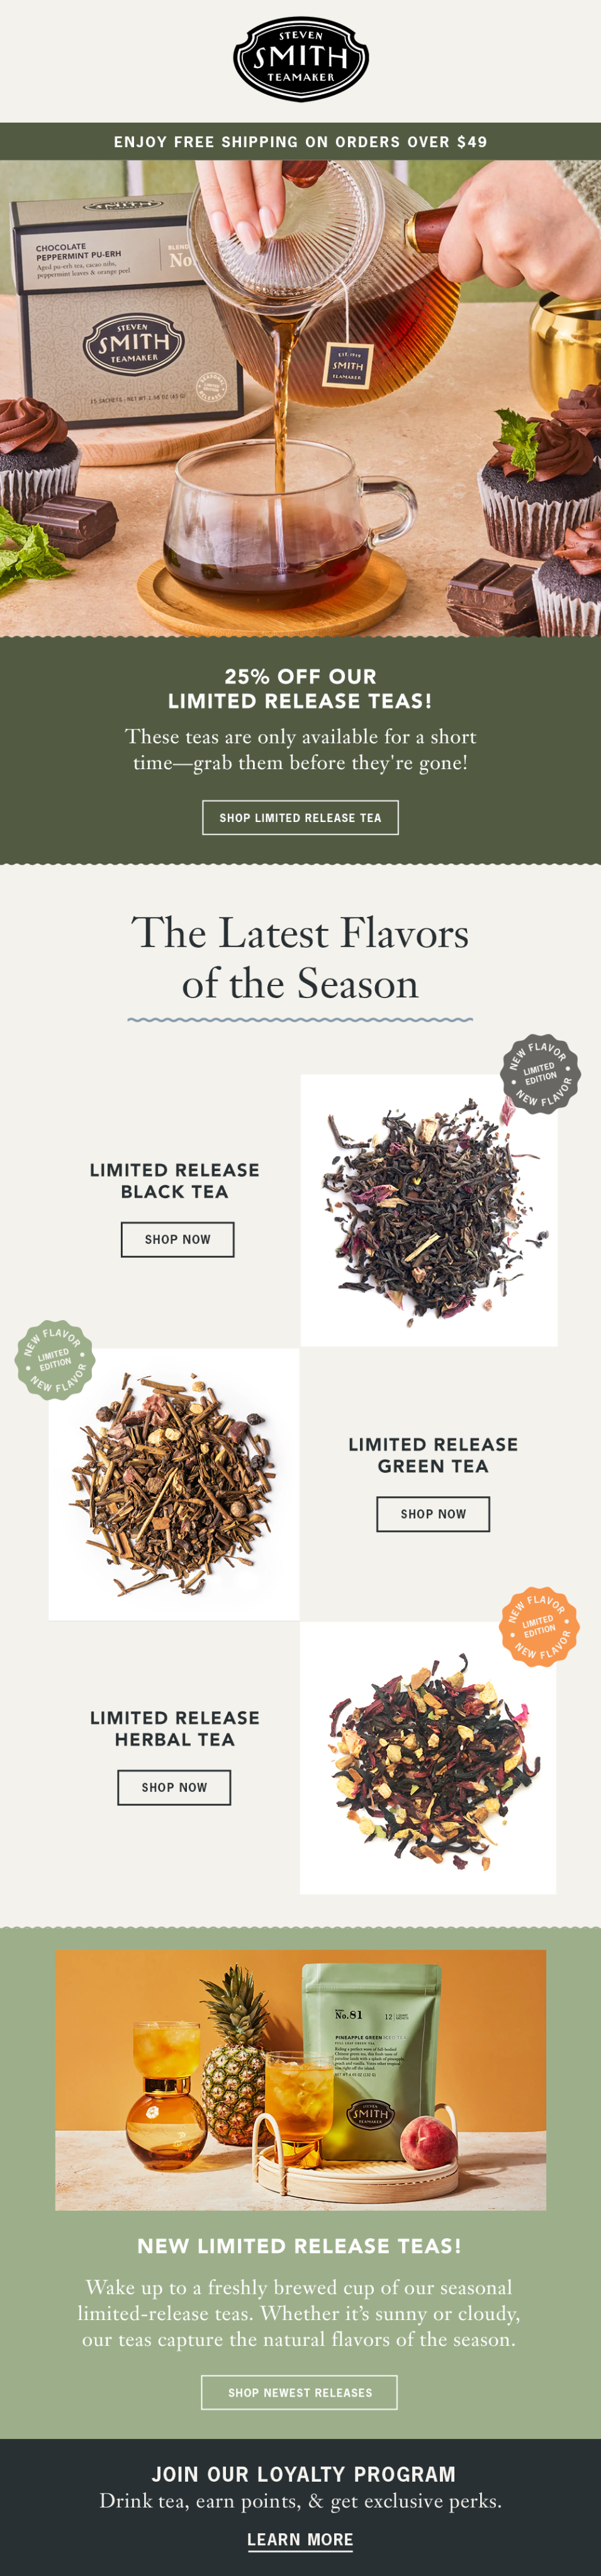 Smith Teamaker
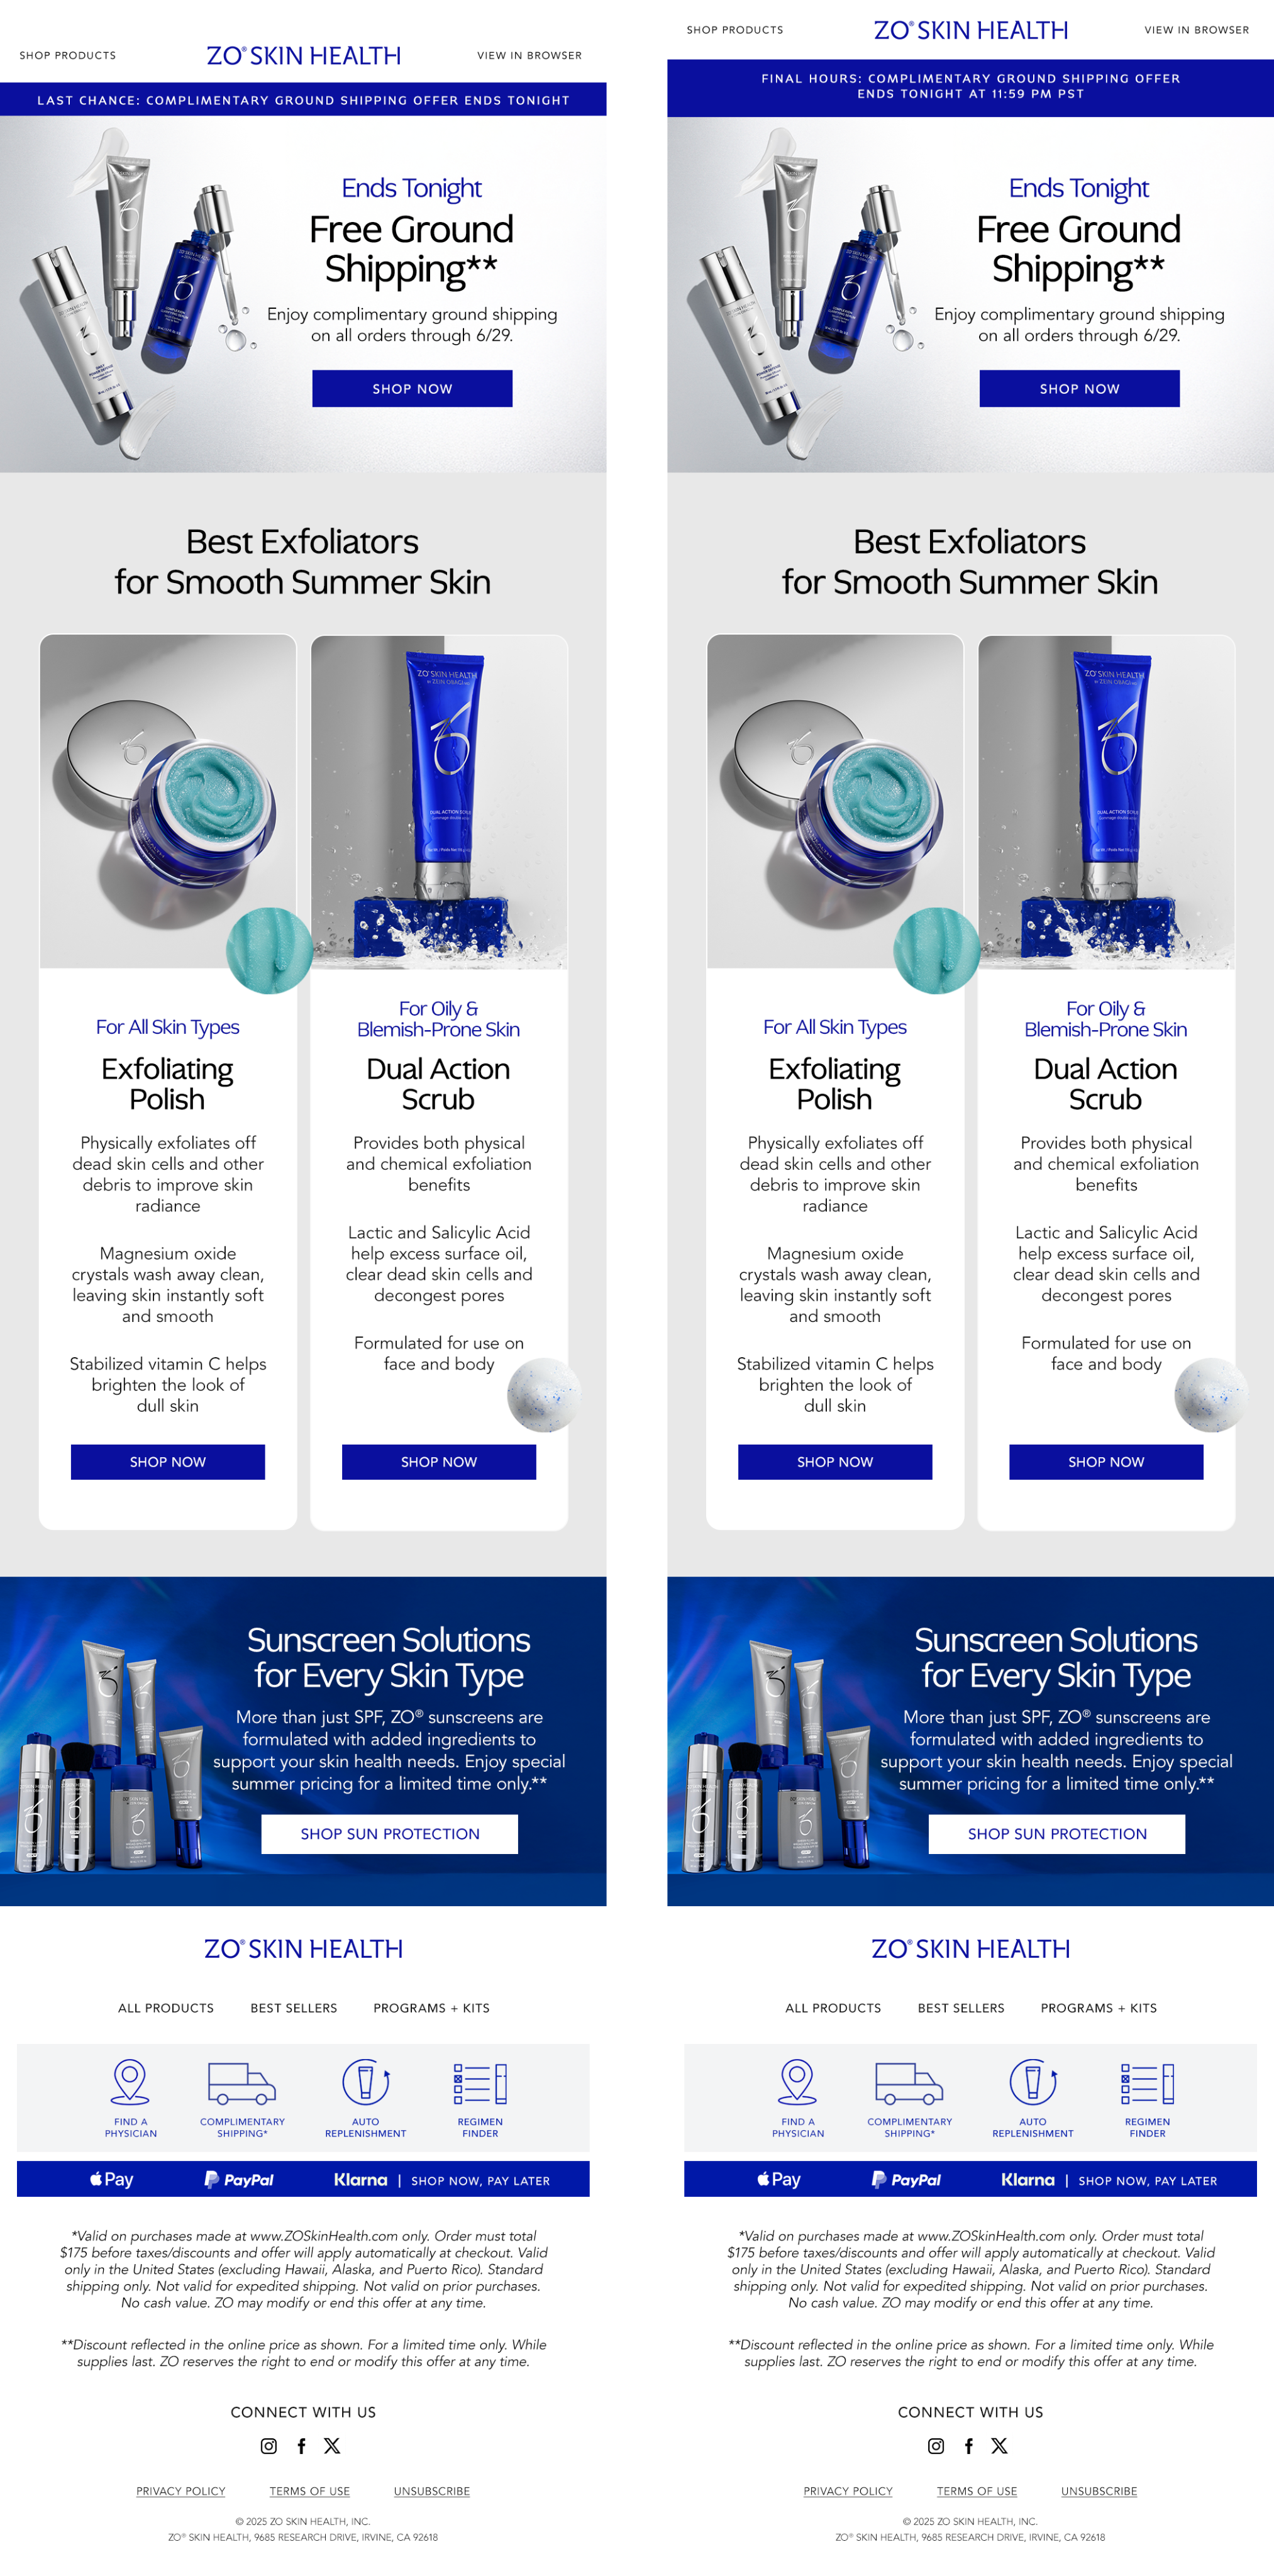 ZO Skin
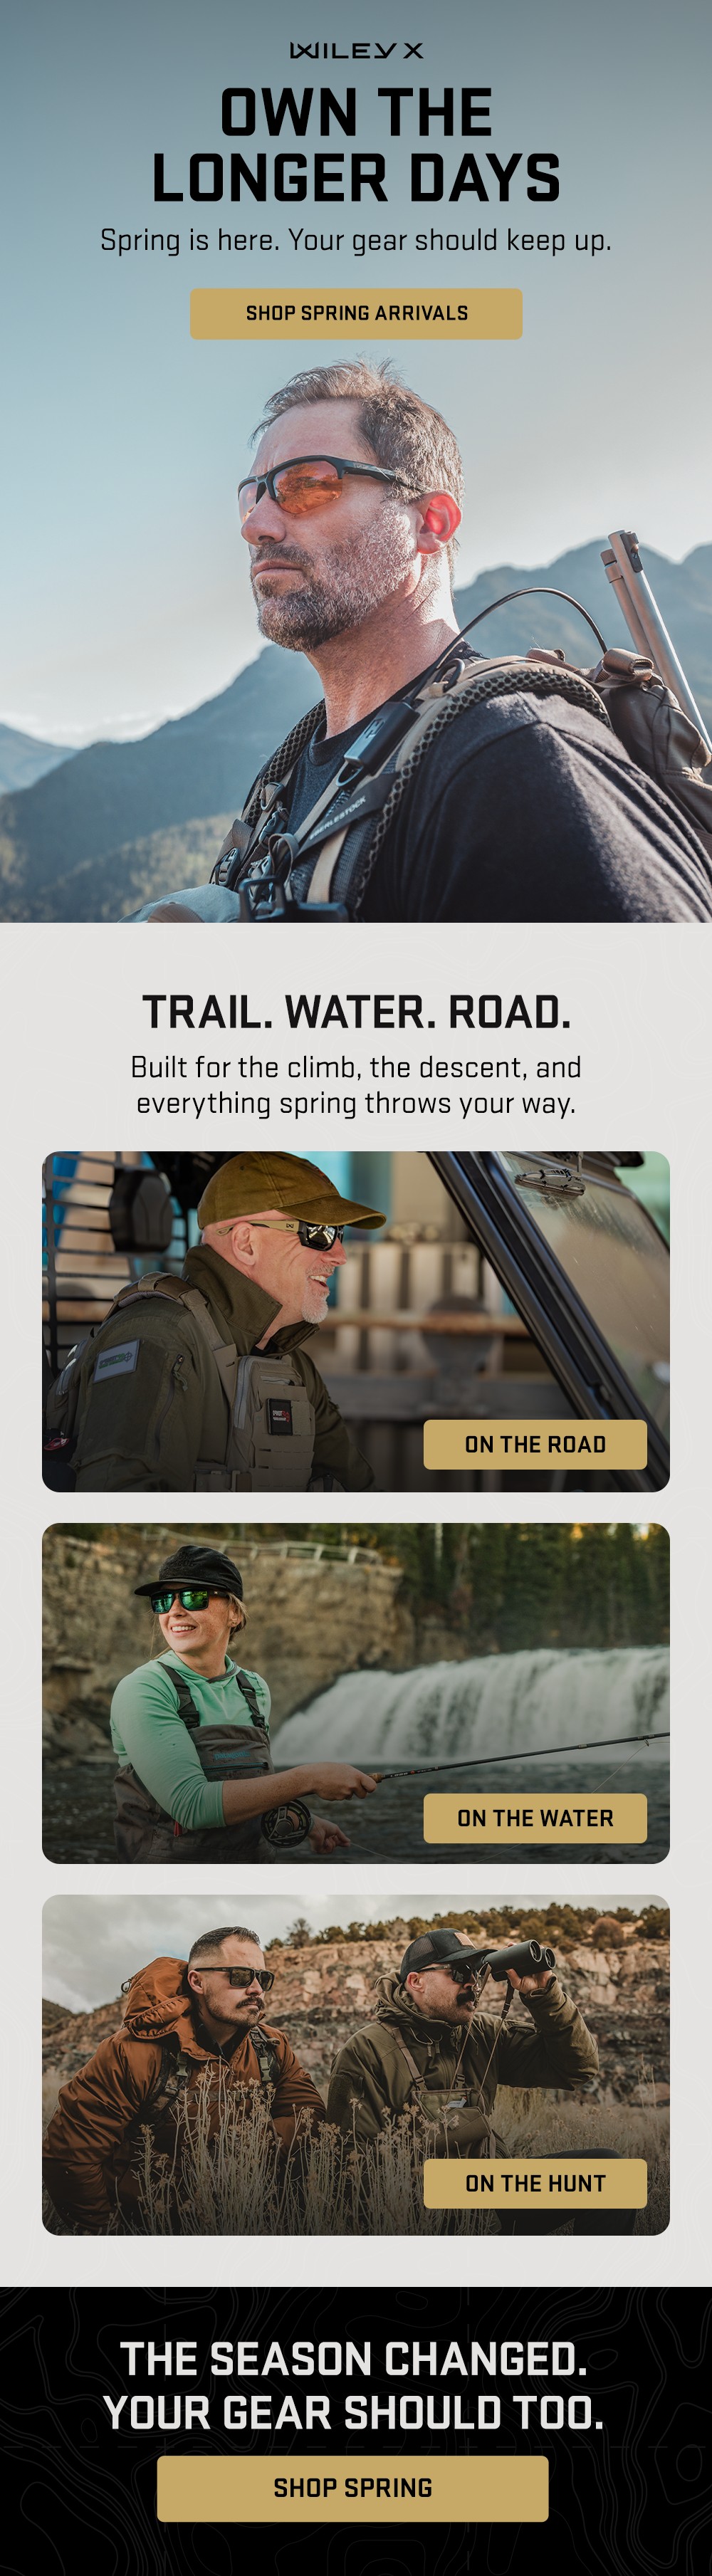 Wiley X
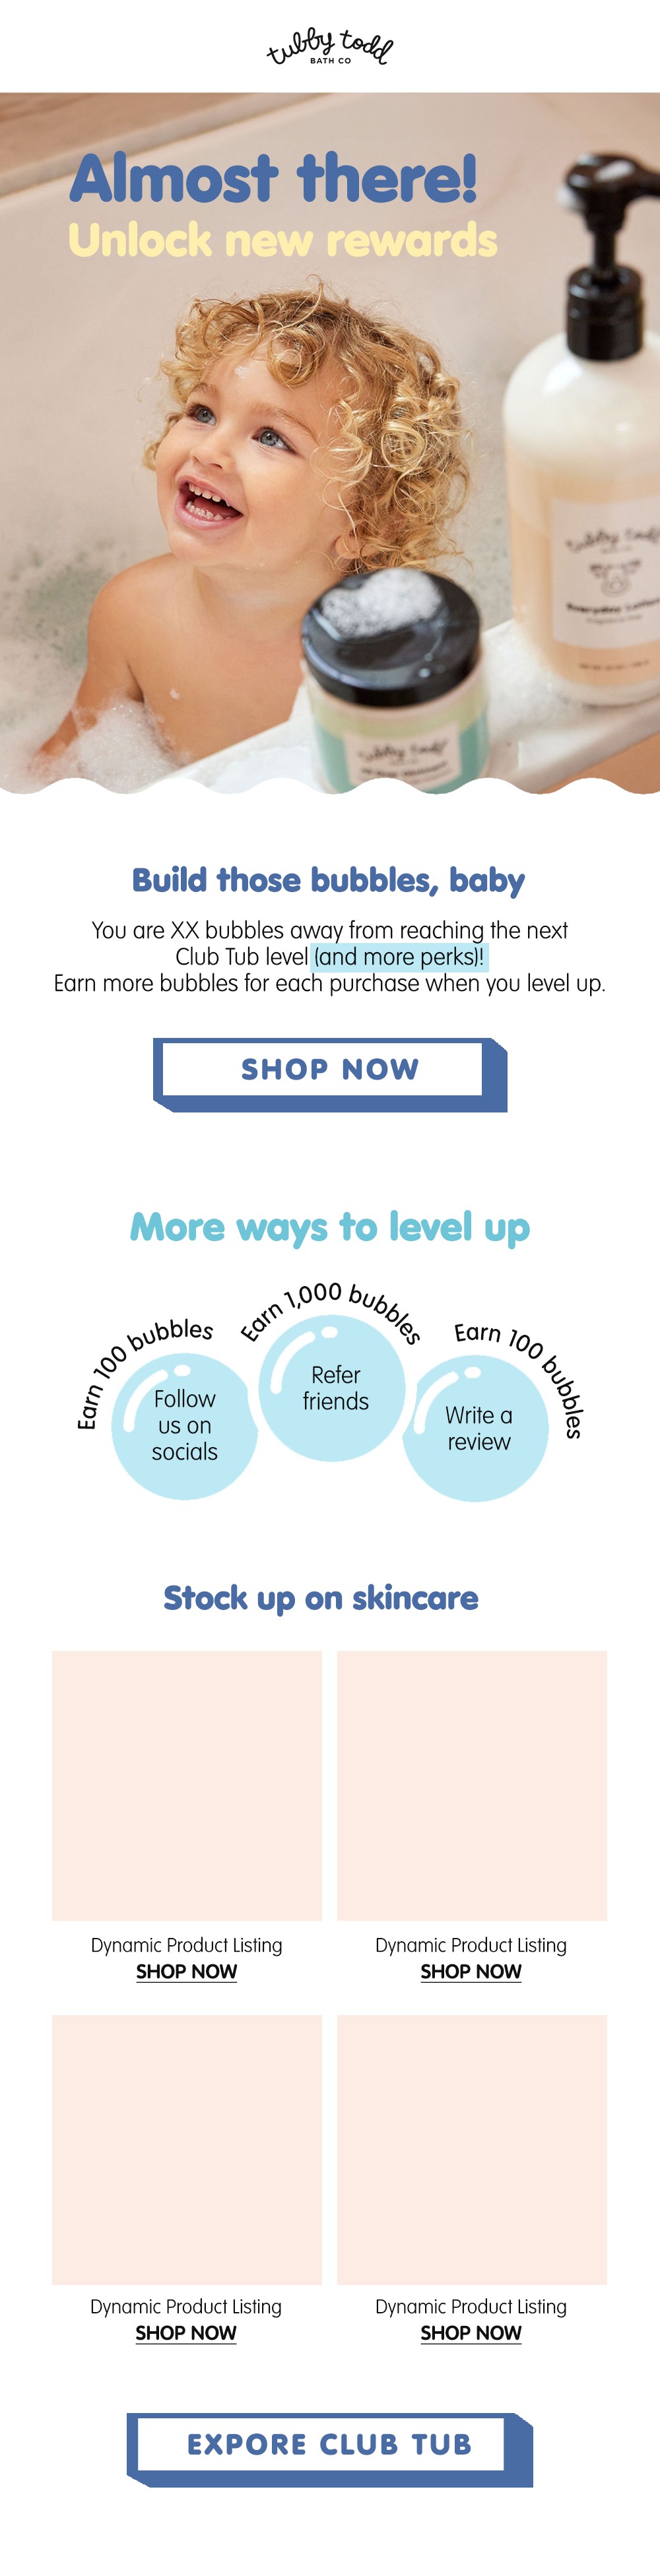 Tubby Todd
 Legend Headwear
 Calaswim
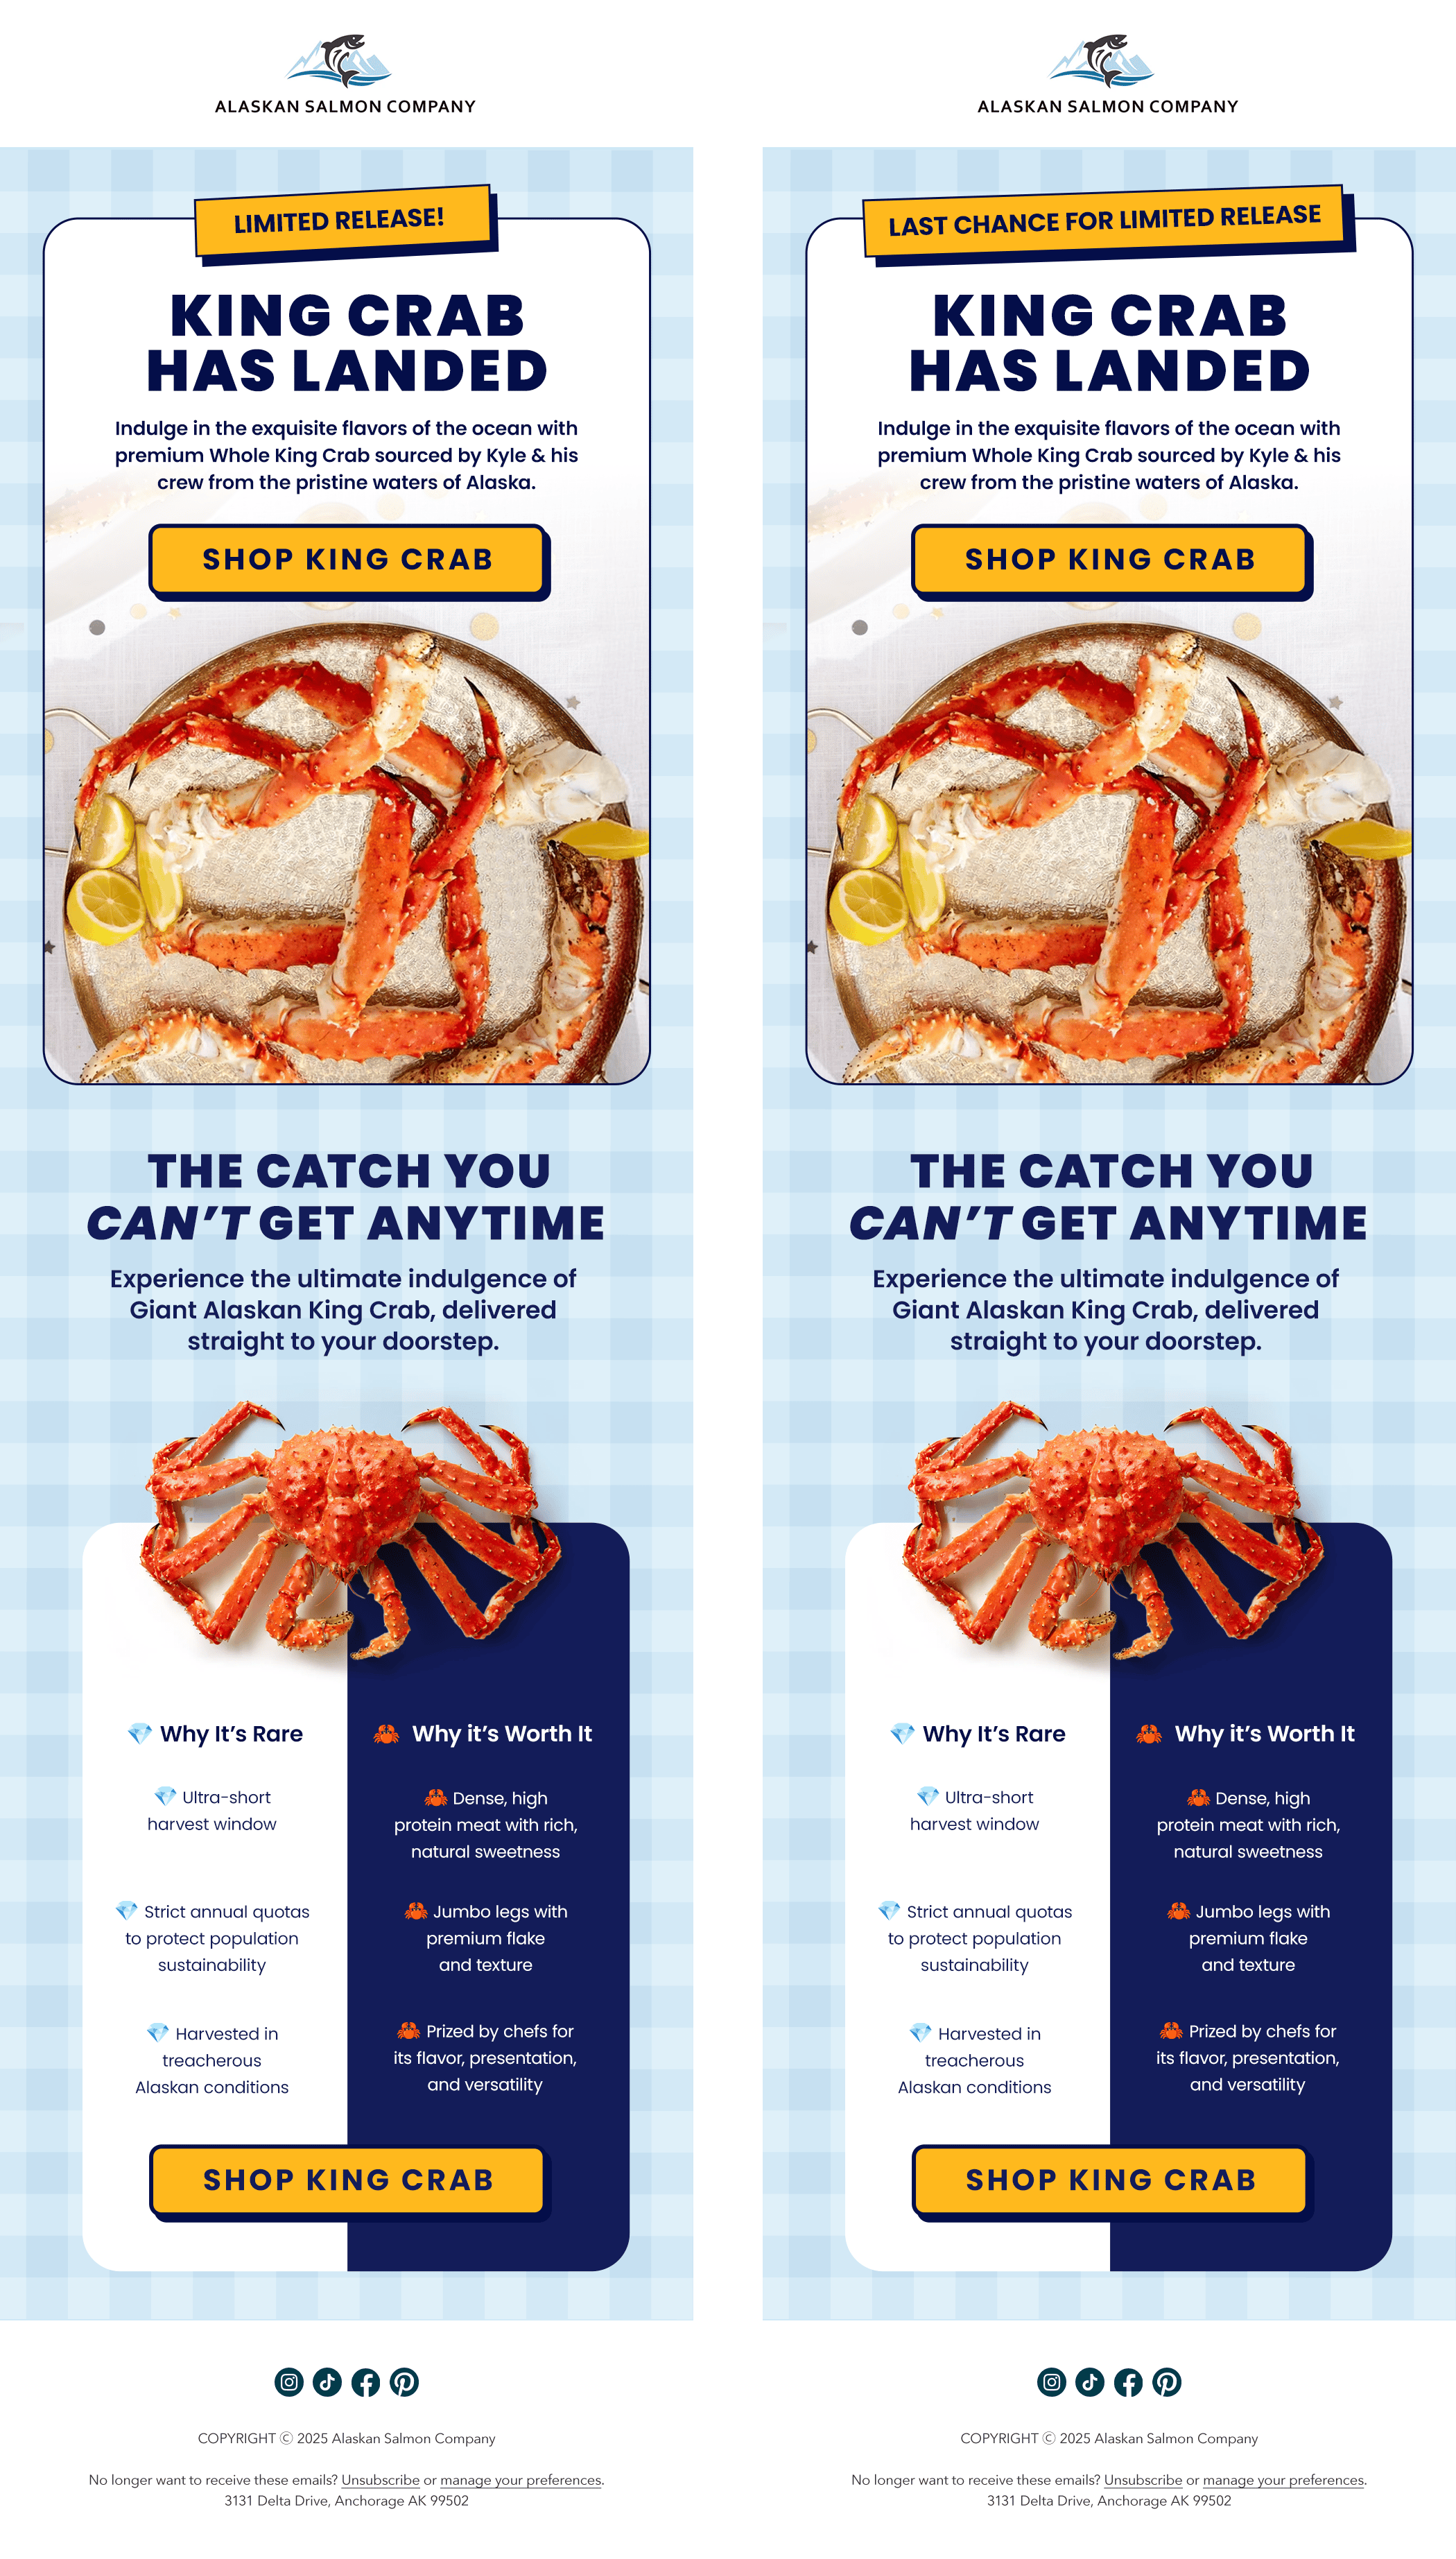 Alaskan Salmon Co.
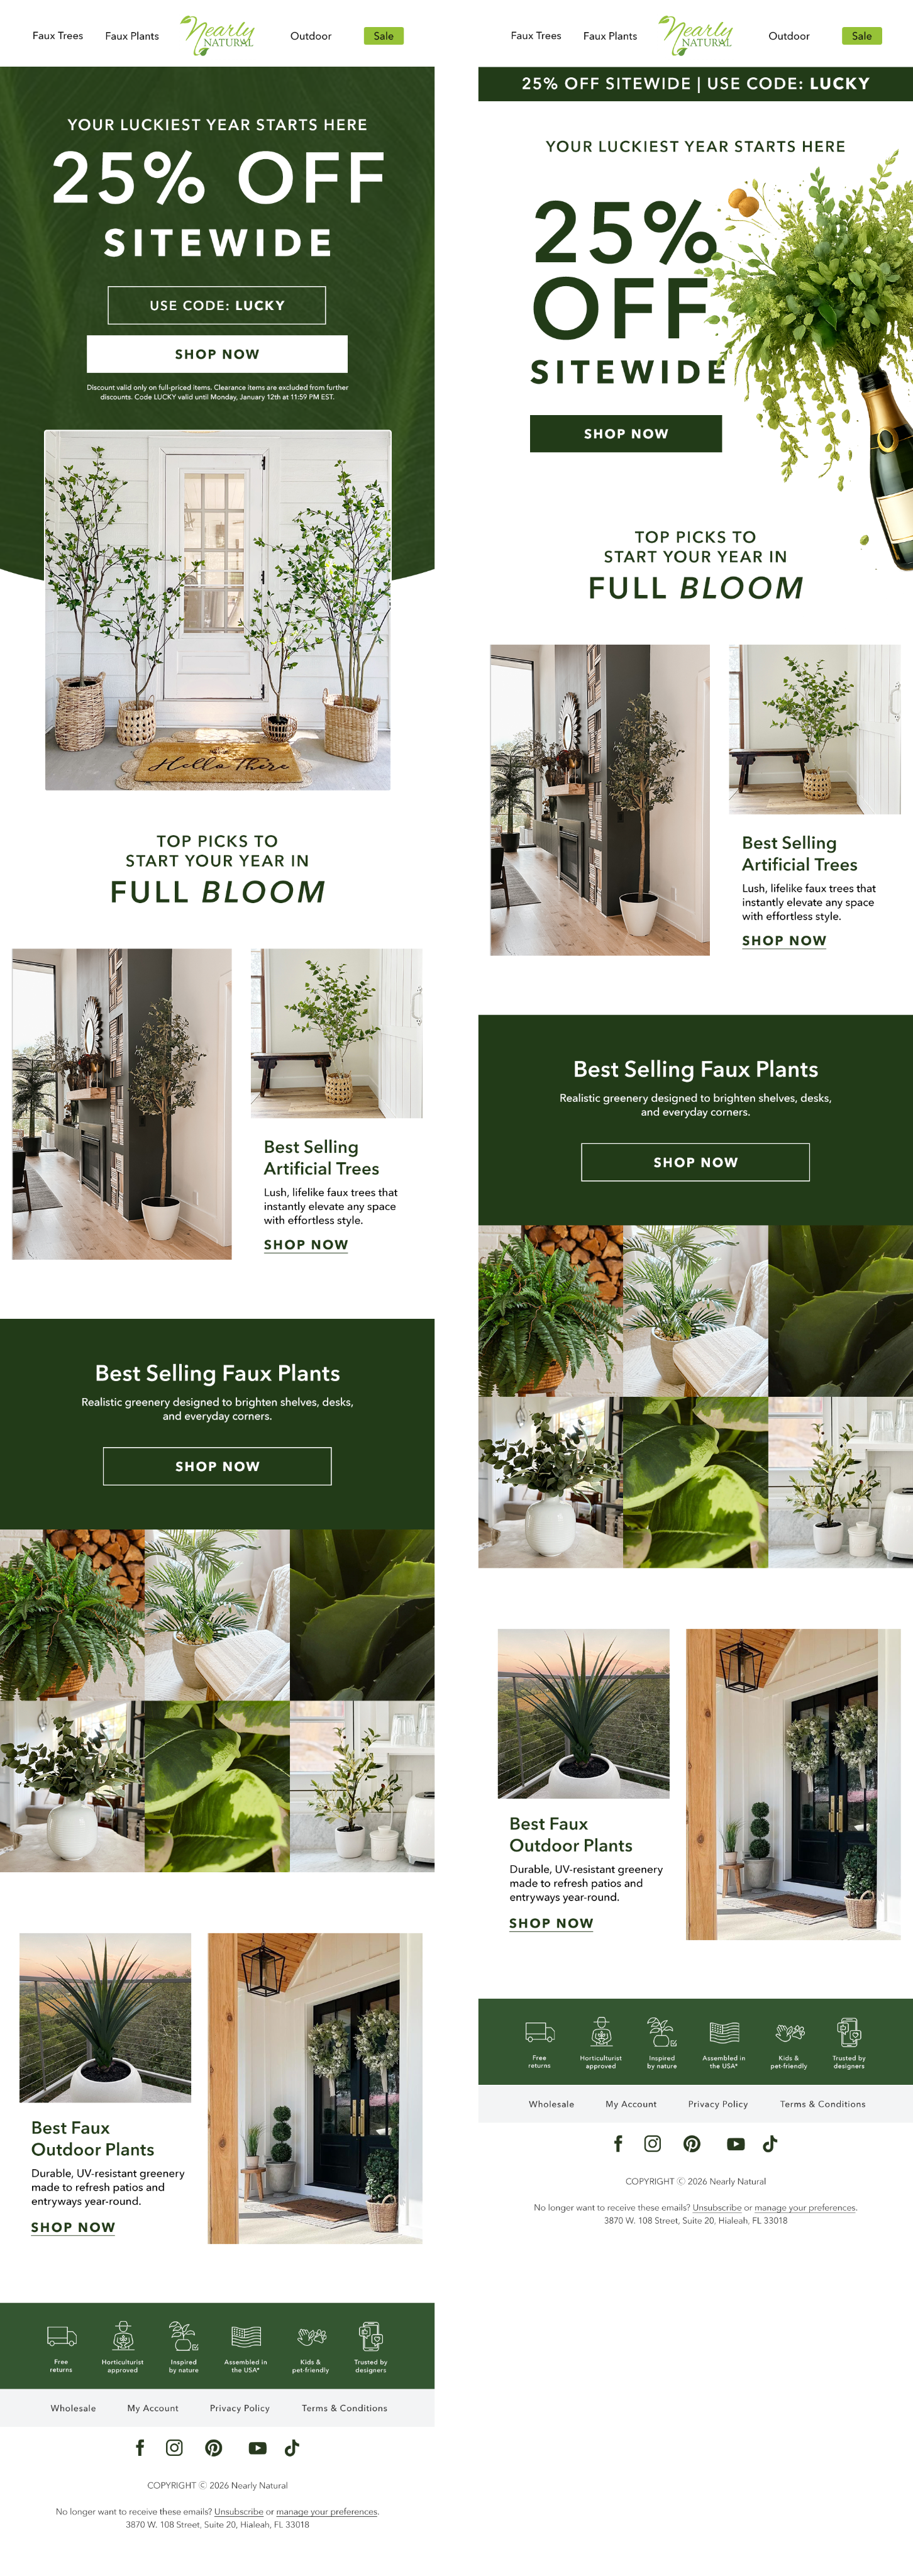 Nearly Natural
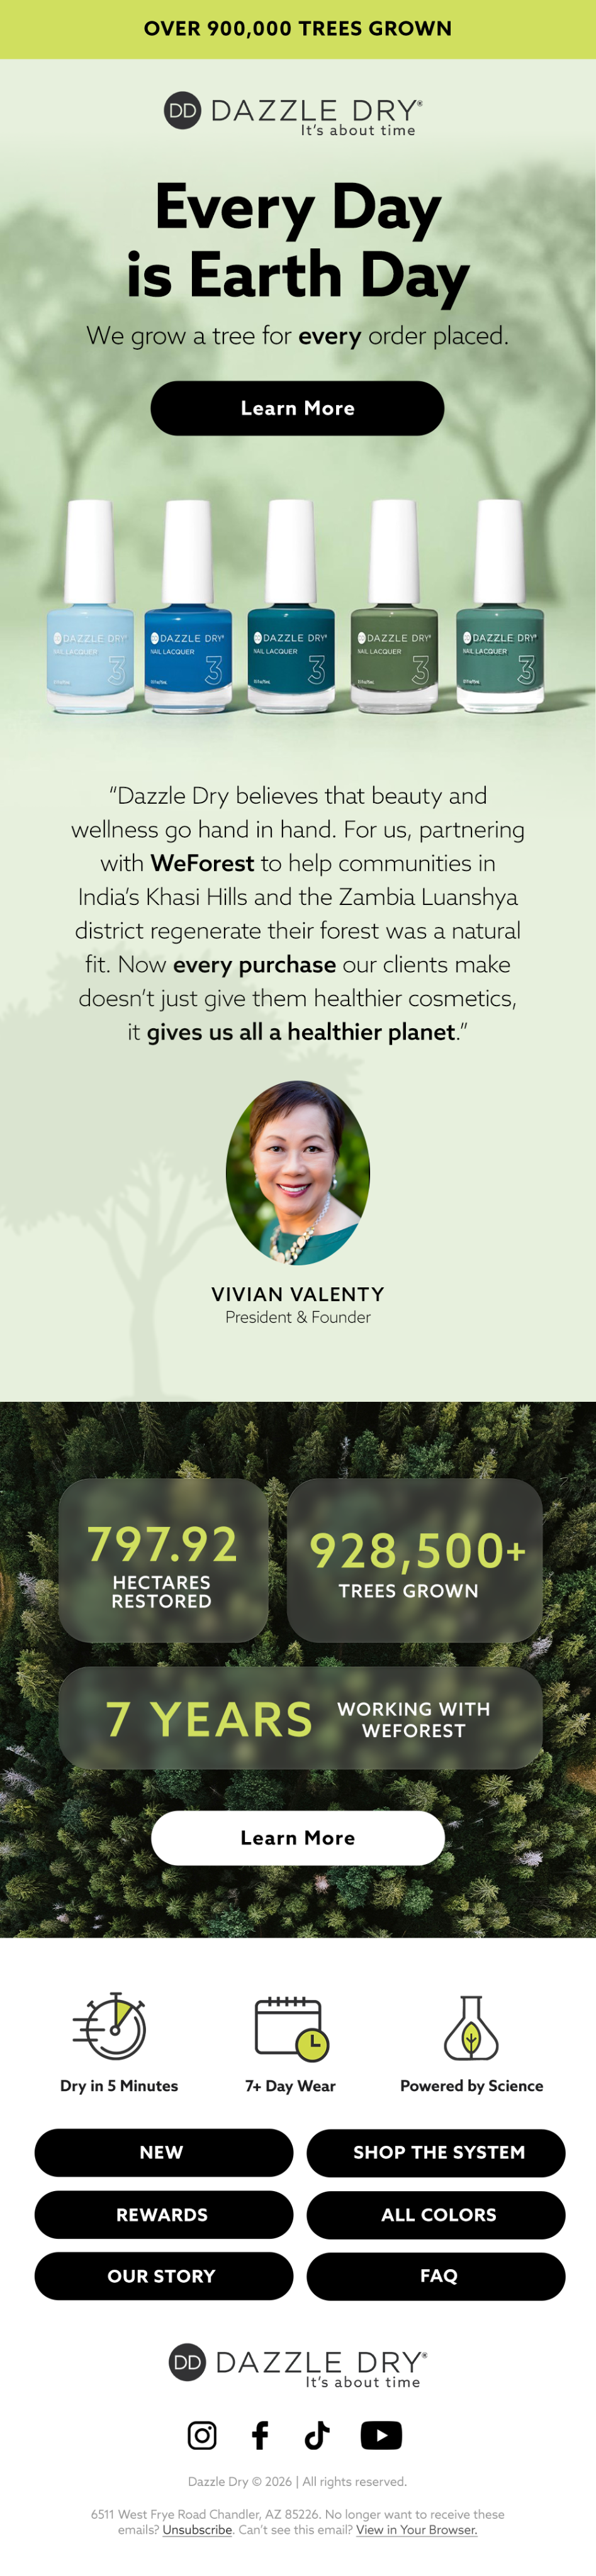 Dazzle Dry
More from Direct to Consumer Retention Topics



Find out what your program is leaving on the table.
A 35 to 40 page audit of your email and SMS program, delivered in 3 to 5 days. It is yours to keep whether or not we work together.
Get my free audit See pricing